


Chapter 6Financial Inclusion and Business Correspondent Model
The Business Correspondent (BC) model has emerged as an important channel for extending formal financial services and credit to underserved households, small enterprises and remote communities, addressing the last-mile constraints of conventional branch-led banking.


Financial Inclusion and Business Correspondent Model
Financial Inclusion and Business Correspondent Model
6.1 Introduction
The Business Correspondent (BC) model has emerged as an important channel for extending formal financial services and credit to underserved households, small enterprises and remote communities. By combining the capital base, regulatory oversight and product capabilities of banks and other regulated lending institutions with the local presence and customer relationships of field-based entities, the model helps address the last-mile constraints of conventional branch-led banking.
The BC model was introduced as part of India’s financial-inclusion efforts, with banks engaging intermediaries to provide basic banking and financial services in underserved areas. The Deepak Mohanty Committee1 on Medium-Term Path to Financial Inclusion, constituted by the Reserve Bank of India in 2015, provided a more structured vision for the BC model and for technology-enabled, affordable and customer-centric financial inclusion. The Committee emphasised convenient access to a basket of formal financial products and services - including savings, remittance, credit, insurance and pension products - for low-income households, small farmers and marginal enterprises.
Initially developed to facilitate basic banking services such as account opening, deposits, withdrawals, remittances and government-benefit payments, the BC model has gradually expanded into credit-related activities. BC partners increasingly support customer sourcing, digital onboarding, KYC verification, borrower assessment, loan documentation, repayment collection, customer servicing and post-disbursement follow-up. For Micro Lending Institutions (MLIs), the model has become an important means of sustaining outreach while reducing reliance on own-balance-sheet funding.
The relevance of the BC model is reinforced by the National Strategy for Financial Inclusion 2025-302, which envisages universal and affordable access to a broad range of formal financial services, supported by technology, customer protection, financial literacy and strong last-mile delivery systems. The strategy recognises the importance of accessible banking touchpoints, including Business Correspondents, in deepening financial inclusion across geographies and population segments. The BC ecosystem is also undergoing rapid digitisation. At the same time, the increasing use of digital processes requires stronger safeguards against fraud, data misuse, customer exclusion, cyber risks and unsuitable lending.
This chapter reviews the progress of BC-led credit operations among MLIs during FY 2025-26. It examines trends in BC portfolio, borrower outreach, lender partnerships, and co-lending arrangements.
1 https://m.rbi.org.in/scripts/PublicationReportDetails.aspx?ID=836
2 https://www.rbi.org.in/commonman/Upload/English/Content/PDFs/English12052026.pdf
6.2 BC Model in Financial Inclusion and Credit Delivery
The evolution of the Business Correspondent model in India can be understood as a progression from a basic branchless-banking channel to a technology-enabled and risk-conscious credit-delivery ecosystem. The Traditional BC Model focuses on assisted banking services such as deposits, withdrawals, remittances, small-value credit support, insurance and pension services, with local presence and customer trust as key attributes (RBI, 20063; RBI Working Group, 20064). The Credit Facilitation Model extends the BC role to borrower sourcing, preliminary loan processing, documentation, customer awareness, repayment follow-up and collections, helping reduce information asymmetry between lenders and borrowers (Sinharay, 20245). The Digital BC Model uses mobile applications, e-KYC, Aadhaar-enabled authentication, digital documentation, bureau checks, e-signatures, UPI-enabled payments and digital collections to improve speed, traceability and efficiency. However, it requires reliable connectivity, customer literacy, fraud controls and data protection (Kumar, Manickaraj and Kulkarni, 20226). The Hybrid BC Model combines field-level customer engagement and assisted service delivery with digital sourcing, collections, supervision and audit, making it particularly relevant for rural and low-income customers who require both trust-based interaction and technology-enabled convenience (SIDBI, 20057). The Resilient BC Model represents the next stage of the BC ecosystem, which combines outreach with governance, agent capability, lender oversight, customer protection, fraud prevention, data security, grievance redressal and business continuity. Its effectiveness should be assessed not only through portfolio growth, but also through customer outcomes, operational reliability and social impact (Goel, Bandara and Gable, 20238).
Figure 6.1: Evolution of the BC model in micro-lending
3 RBI, 2006
4 RBI Working Group, 2006
5 EPW, 2024
6 Kumar, N., Manickaraj, M., & Kulkarni, S. Advancing Digital Financial Inclusion by Leveraging Business Correspondent Model. India Banking and Finance Report, 159
7 SIDBI, 2005
8 Springer, 2023
6.3 Progress of BC-led Financial Inclusion
The BC channel has contributed to the expansion of banking access, digital payments and formal credit outreach across rural and semi-urban India. BC outlets complement bank branches by enabling customers to access financial services nearer to their homes, workplaces and communities.
The financial-inclusion landscape has also been shaped by UPI, Aadhaar-enabled payment services, digital identity infrastructure, Direct Benefit Transfer, mobile banking and assisted digital services. These developments create opportunities for BCs to help customers use formal accounts actively, access government benefits and develop digital financial capability.
The Reserve Bank of India’s composite Financial Inclusion Index9 (FI-Index), developed in consultation with key stakeholders including the Government of India, tracks the extent of financial inclusion across the country. Introduced in August 2021 for the financial year ending March 2021, the Index captures progress across three dimensions: Access, Usage and Quality. The FI-Index increased to 70.0 in March 2026, from 67.0 in March 2025, indicating continued improvement in the reach and usage of formal financial services, as well as the quality of service delivery. The improvement reinforces the need to strengthen the role of BCs as accessible and trusted last-mile service points, particularly for low-income households, women, small enterprises and customers in remote areas.
However, access to an account or a BC outlet alone does not ensure meaningful financial inclusion. The quality of inclusion depends on whether customers can use accounts regularly, receive timely financial services, understand product terms, access grievance redressal and avoid fraud or unsuitable borrowing.
Table 6.1: Monitoring Progress of Financial Inclusion
| Particulars | Dec-24 | Dec-25 | Change between Dec’24 & Dec’25 |
|---|---|---|---|
| Number of Banking Outlets Manned by Bank’s Own Staff - Branches | 56,579* | 1,70,189 | 1,13,610 |
| Number of Banking Outlets Manned by Business Correspondents (Fixed Point BC Outlet) | NA | 11,75,250 | - |
| Basic Savings Bank Deposit Accounts (BSBDA - Total Number in lakh) | 7,201 | 7,304 | 103 |
| Out of Total Number of BSBDAs, Number of Female Account Holders (Number in lakh) | NA | 4,024 | - |
| BSBDA - Total (Amount in ₹ crore) | 3,04,715 | 3,45,477 | 40,762 |
| Out of Total Amount in BSBDAs, Amount in Female Account Holders’ Accounts (Amount in ₹ crore) | NA | 2,06,095 | - |
| Overdraft (OD) Facility Availed in BSBDAs (Number in lakh) | 45 | 32 | -13 |
| Out of Total, OD Facility Availed in BSBDAs by Females (Number in lakh) | NA | 17 | - |
| OD Facility Availed in BSBDAs (Amount in ₹ crore) | 548 | 414 | -134 |
| Out of Total, OD Facility Availed in BSBDAs by Females (Amount in ₹ crore) | NA | 193 | - |
| Information and Communication Technology (ICT) - BC-Total Transactions (Number in lakh) | 29,944 | 39,413 | 9,469 |
| Out of Total ICT-BC Transactions, Transactions Undertaken by Female BC agents (Number in lakhs) | NA | 6,920 | - |
| ICT - BC-Total Transactions (Amount in ₹ crore) | 10,73,073 | 11,89,767 | 1,16,694 |
| Out of Total ICT-BC Transactions, Transactions Undertaken by Female BC agents (Amount in ₹ crore) | NA | 2,31,285 | - |
Source: RBI Annual Report 2025-26
* Data are for banking outlet manned by bank’s own staff (i.e., branches) in villages
9 https://www.rbi.org.in/scripts/BS_PressReleaseDisplay.aspx?prid=63164
6.4 MLIs as Business Correspondents: Trends in Credit Operations
MLIs have increasingly used BC arrangements to diversify funding sources, preserve last-mile credit outreach and leverage their field infrastructure. Under this arrangement, the regulated lender provides funding and retains responsibility for the credit exposure, while the MLI undertakes agreed sourcing, servicing and collection activities.
The BC model offers several potential benefits to lenders and MLIs:
- Expansion of credit outreach without proportionate branch expansion
- Access to trained field teams and established borrower relationships
- Lower customer-acquisition and servicing costs
- Improved availability of local information for underwriting and monitoring
- Diversification of funding channels for MLIs
- Opportunity for banks and NBFCs to serve priority and underserved segments
- Digital collection trails and more timely portfolio monitoring
At the same time, growth in BC-led lending must be accompanied by appropriate lender oversight, customer-protection safeguards, field-staff capability, technology controls and clear accountability for each stage of the lending journey.
Table 6.2: Trend in MLIs operating as Business Correspondents
| Year | No. of Reporting MLIs excluding Banks & SFBs | No. of Reporting MLIs with BC operations | BC portfolio (in ₹ Crore) | BC borrowers (in Lakhs) | BC portfolio as % of total MLI portfolio | Growth in BC portfolio |
|---|---|---|---|---|---|---|
| FY 2021-22 | 213 | 77 | 30,517 | 101.20 | 23% | 23% |
| FY 2022-23 | 213 | 81 | 38,617 | 114.23 | 21% | 27% |
| FY 2023-24 | 217 | 104 | 54,416 | 145.39 | 21% | 41% |
| FY 2024-25 | 203 | 90 | 53,287 | 129.61 | 22% | -2% |
| FY 2025-26 | 178 | 84 | 51,004 | 102.43 | 21% | -4% |
The Business Correspondent model recorded strong growth between FY 2021-22 and FY 2023-24, with the BC portfolio as well as the number of MLIs operating through the BC model increasing, indicating the growing importance of BC arrangements as a funding-diversification and last-mile credit-delivery mechanism for MLIs.
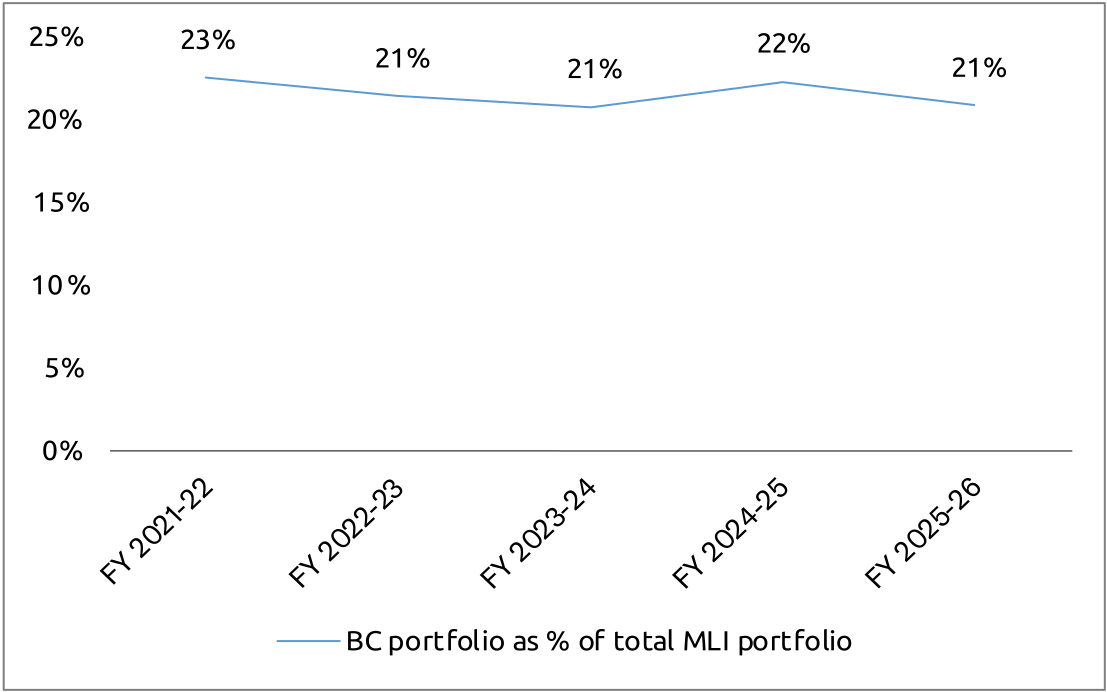
The growth momentum, however, moderated in FY 2024-25 and reversed in FY 2025-26. The BC portfolio declined marginally by 2% in FY 2024-25, from ₹54,416 crore to ₹53,287 crore, before declining further by 4% to ₹51,004 crore in FY 2025-26. The BC portfolio as a proportion of the total MLI portfolio also reduced from 22% in FY 2024-25 to 21% in FY 2025-26. The decline in the BC portfolio should be viewed in the context of the wider microfinance-sector correction during FY 2025-26. Over the preceding quarters, lenders adopted more cautious growth strategies in response to elevated repayment stress, increased delinquency, borrower over-leverage concerns and the need to strengthen underwriting and collection practices. Loan portfolios were rationalised, fresh disbursements were moderated in certain geographies and lenders focused on improving the quality of their existing portfolios rather than pursuing rapid expansion.
At the sectoral level, the microfinance sector experienced a significant contraction during FY 2025-26. The borrower base under the BC model also declined from 129.61 lakh borrowers in FY 2024-25 to 102.43 lakh borrowers in FY 2025-26. This represents a reduction of 27.18 lakh borrowers, or around 21%. The sharper decline in borrower numbers relative to the decline in portfolio suggests that lenders and BC partners may have reduced lower-ticket or marginal borrower exposures, tightened borrower-selection criteria, curtailed lending in higher-risk geographies, and focused on servicing relatively stronger or more established customer segments.
As against 203 MLIs reported their data in FY 2024-25, only 178 MLIs have reported their data in FY 2025-26. As a result, there has been reduction in the number of MLIs with BC operation, the number declining from 90 to 84. Therefore, the year-on-year movement in BC portfolio reflects both the sector-wide moderation in lending activity and the change in the reporting universe. Notwithstanding the decline, BC arrangements continued to account for a substantial share of managed credit operations. As of 31 March 2026, the BC portfolio of 84 MLIs engaged in BC operations stood at ₹51,004 crore. This represented approximately 70% of the total reported off-balance-sheet portfolio of ₹73,027 crore across 178 reporting MLIs. This indicates that BC-led lending remained the predominant off-balance-sheet portfolio model for reporting MLIs, despite the broader slowdown in microfinance lending.
Figure 6.2: Trend in BC portfolio
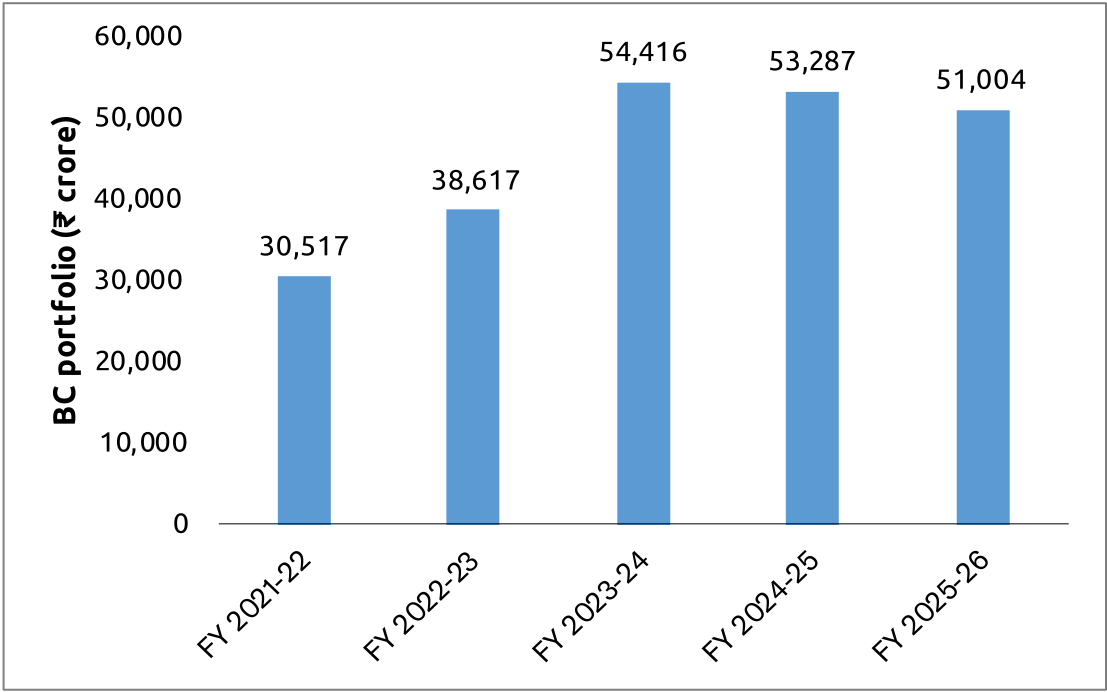
Figure 6.3: Trend of BC portfolio as a share of total MLI portfolio
The FY 2025-26 trend therefore reflects a transition from expansion-led BC growth towards a more cautious and risk-sensitive operating environment. Going forward, the BC model is likely to remain important for banks, NBFCs and MLIs seeking to maintain last-mile outreach. However, future growth will depend on stronger borrower assessment, responsible lending practices, effective collection and servicing systems, improved lender oversight, digital controls, field-staff capacity and robust customer-protection mechanisms.
6.5 Composition of BC Portfolio and Portfolio Concentration
The composition of the BC portfolio provides insight into the institutional structure, concentration and partnership dynamics of BC-led credit operations. While the aggregate portfolio indicates the overall scale of the model, a legal-form-wise analysis helps identify the types of MLIs participating in BC arrangements and the relative size of their managed portfolios. It also indicates whether BC-led lending is dispersed across a broad set of institutions or concentrated among a limited number of large MLIs.
Table 6.3: Legal Form-wise distribution of BC portfolio as of 31 March 2026
| Legal form of MLI | Number of lending partners | Number of MLIs engaged in BC Operation | BC portfolio (in ₹ Crore) | Share in total BC portfolio |
|---|---|---|---|---|
| NBFC-MFIs | 111 | 44 | 6,949 | 14% |
| NBFCs | 30 | 11 | 506 | 1% |
| Private Limited Companies | 64 | 15 | 14,690 | 29% |
| Section 8 Companies | 13 | 6 | 212 | 0.41% |
| Others (Trusts / Societies) | 15 | 8 | 28,647 | 56% |
| Total | 233* | 84 | 51,004 | 100% |
* Cumulative MLI-lender relationships and not unique Banks/FIs
As of 31 March 2026, the BC portfolio of 84 reporting MLIs stood at ₹51,004 crore. Trusts and societies accounted for the largest share of the portfolio at ₹28,647 crore, representing 56% of the total BC portfolio, despite comprising only eight MLIs. However, this category-level share is substantially influenced by one trust, whose entire GLP of ₹28,551 crore is reported under the BC model. Therefore, the high share of trusts and societies should not be interpreted as reflecting broad-based BC operations across institutions under this legal form.
Excluding this single trust, the BC portfolio of the remaining 83 reporting MLIs stands at ₹22,453 crore. Within this adjusted portfolio, private limited companies account for the largest share at ₹14,690 crore, or around 65%, followed by NBFC-MFIs at ₹6,949 crore, or around 31%. Thus, excluding the exceptionally large trust, the BC ecosystem is primarily driven by private limited companies and NBFC-MFIs, which together account for around 96% of the adjusted BC portfolio. NBFC-MFIs demonstrate the widest participation in the BC ecosystem, with 44 NBFC-MFIs reporting 111 lender engagements. Their relatively lower portfolio share, despite their larger number, indicates that BC operations among NBFC-MFIs are more dispersed across institutions and lender partnerships. The 233 lender engagements reported in the Table 6.3 represent cumulative MLI-lender BC relationships and should not be construed as the number of unique Banks/FIs. The same lender may have BC arrangements with multiple MLIs and is therefore counted separately for each such engagement. Table 6.4 presents the Bank/Financial Institution-wise distribution of lending partners engaged with MLIs under BC arrangements.
Table 6.4: Banks/Financial Institutions-wise data on lending partners in BC Engagement with MLIs as of 31 March 2026
| Sl. No. | Name of the Bank (Commercial Banks, Small Finance Banks, Regional Rural Banks, Cooperative Banks) | Number of MLIs engaged in BC Operation | Number of Loan Accounts (in lakhs) | Loan Portfolio (in ₹ Crore) |
|---|---|---|---|---|
| 1 | AU Small Finance Bank | 5 | 0.77 | 180 |
| 2 | Axis Bank Ltd. | 3 | 0.52 | 120 |
| 3 | Bank of Baroda | 1 | 10.52 | 7,216 |
| 4 | Bank of Maharashtra | 1 | 3.12 | 2,140 |
| 5 | Canara Bank | 1 | 0.0036 | 3 |
| 6 | CSB Bank Ltd. | 10 | 0.49 | 115 |
| 7 | DCB Bank Ltd. | 4 | 1.15 | 317 |
| 8 | Equitas Small Finance Bank | 1 | 0.56 | 89 |
| 9 | ESAF Small Finance Bank | 15 | 6.92 | 3,648 |
| 10 | Federal Bank Ltd. | 15 | 6.01 | 1,952 |
| 11 | ICICI Bank Ltd. | 2 | 0.44 | 167 |
| 12 | IDBI Bank Ltd. | 12 | 7.19 | 4,664 |
| 13 | IDFC First Bank Ltd. | 3 | 0.11 | 41 |
| 14 | IndusInd Bank Ltd. | 1 | 1.08 | 275 |
| 15 | Jana Small Finance Bank | 15 | 2.83 | 793 |
| 16 | Karnataka Bank Ltd. | 1 | 2.05 | 1,406 |
| 17 | Karnataka Grameena Bank | 1 | 6.37 | 4,367 |
| 18 | Karur Vysya Bank Ltd. | 1 | 0.4 | 81 |
| 19 | Kotak Mahindra Bank Ltd. | 3 | 17.75 | 6,384 |
| 20 | Panipat Urban Co-operative Bank | 1 | 0.07 | 29 |
| 21 | Progressive Co-op Bank Ltd. | 1 | 0.0027 | 0.14 |
| 22 | RBL Bank | 1 | 1.26 | 367 |
| 23 | Shivalik Small Finance Bank | 2 | 1.17 | 363 |
| 24 | South Indian Bank Ltd. | 1 | 0.54 | 175 |
| 25 | State Bank of India | 2 | 13.91 | 9,496 |
| 26 | Suryoday Small Finance Bank | 2 | 0.79 | 290 |
| 27 | Ujjivan Small Finance Bank | 1 | 0.02 | 3 |
| 28 | Unity Small Finance Bank | 2 | 0.32 | 126 |
| 29 | Utkarsh Small Finance Bank | 5 | 0.56 | 208 |
| 30 | YES Bank Ltd. | 6 | 3.63 | 1,138 |
| Sl. No. | Name of the Financial Institution (All-India Financial Institutions, NBFCs, NBFC-MFIs, Housing Finance Companies, Fintechs, cooperative credit societies) | Number of MLIs engaged in BC Operation | Number of Loan Accounts (in lakhs) | Loan Portfolio (in ₹ Crore) |
| 31 | Asha Vaibhav Co-op Credit Society | 1 | 0.01 | 1 |
| 32 | Aajivika Finance Ltd. | 1 | 0.02 | 6 |
| 33 | Ananya Finance for Inclusive Growth Pvt. Ltd. | 2 | 0.04 | 9 |
| 34 | Annapurna Finance Pvt. Ltd. | 1 | 0.02 | 2 |
| 35 | Arohan Financial Services Ltd. | 4 | 0.22 | 61 |
| 36 | Arthmate Financing India Pvt. Ltd. | 3 | 0.01 | 1 |
| 37 | Avanti Finance Pvt. Ltd. | 20 | 2.46 | 577 |
| 38 | Caspian Impact Investments Adviser Pvt. Ltd. | 2 | 0.48 | 154 |
| 39 | Electronica Finance Ltd. | 1 | 0.01 | 2 |
| 40 | Finaleap Finserv Pvt. Ltd. | 1 | 0.0006 | 0.03 |
| 41 | Finstars Capital Ltd. | 1 | 0.0035 | 1 |
| 42 | Gosree Finance Ltd. | 1 | 0.0025 | 0.17 |
| 43 | Godavari Urban Multistate Credit Co-operative Society | 1 | 0.23 | 77 |
| 44 | Grow Money Capital Pvt. Ltd. | 2 | 0.05 | 18 |
| 45 | Hinduja Leyland Finance | 1 | 0.43 | 155 |
| 46 | IIFL Finance Ltd. | 1 | 0.83 | 1,037 |
| 47 | Kaleidofin Capital Pvt. Ltd. | 3 | 0.07 | 15 |
| 48 | MAS Financial Services Ltd. | 6 | 0.23 | 104 |
| 49 | Maxemo Capital Services Pvt. Ltd. | 1 | 0.001 | 1 |
| 50 | Monexo Fintech Pvt. Ltd. | 6 | 0.17 | 41 |
| 51 | Muthoot Finance Ltd. | 1 | 0.02 | 7 |
| 52 | NABARD Financial Services Ltd. (NABFINS) | 1 | 0.0036 | 3 |
| 53 | North Eastern Development Finance Corporation Ltd. | 4 | 0.13 | 84 |
| 54 | Northern Arc Capital Ltd. | 3 | 0.52 | 133 |
| 55 | Nutan Ekta Credit Co-op Society | 1 | 0.0035 | 0.47 |
| 56 | Piramal Capital & Housing Finance Ltd. | 1 | 1.77 | 474 |
| 57 | Piramal Finance Ltd. | 2 | 0.4 | 103 |
| 58 | Pushpak Financial Services Pvt. Ltd. | 1 | 0.07 | 25 |
| 59 | Real Touch Finance Ltd. | 1 | 0.01 | 1 |
| 60 | Richmax Finvest Pvt. Ltd. | 1 | 0.0024 | 0.0001 |
| 61 | RupeeCircle | 1 | 0.0027 | 0.25 |
| 62 | Samunnati Finance Pvt. Ltd. | 4 | 0.04 | 6 |
| 63 | Save Financials Services Pvt. Ltd. | 1 | 0.0018 | 11 |
| 64 | Sahayog Multistate Credit Co-operative Society Ltd. | 1 | 0.03 | 10 |
| 65 | Shri Padmavati Mata Multi State Co-op Society | 1 | 0.0027 | 0.15 |
| 66 | Shri Venkatesh Multi State Co-op Society | 1 | 0.0023 | 0.14 |
| 67 | Shriram Finance Ltd. | 1 | 0.0006 | 1 |
| 68 | SIDBI | 16 | 0.9 | 905 |
| 69 | Sub-K IMPACT Solutions Ltd. | 1 | 2.49 | 735 |
| 70 | UGRO Capital Ltd. | 1 | 0.02 | 44 |
| 71 | Usha Financial Services Pvt. Ltd. | 1 | 0.01 | 1 |
| 72 | Utkarsh Co-operative Credit Society Ltd. | 1 | 0.0005 | 0.15 |
| 73 | Vivriti Capital Ltd. | 1 | 0.003 | 6 |
| 74 | Venkatesha Multi State Co-op Society | 1 | 0.002 | 0.13 |
| 75 | Others | 7 | 0.18 | 58 |
| Total | 233 | 102.43 | 51,004 |
Table 6.5: Distribution of MLIs by number of BC lending partners
| Number of lending partners | Number of MLIs engaged in BC Operation | Share of MLIs | BC portfolio (₹ crore) | Share of BC portfolio |
|---|---|---|---|---|
| One | 37 | 44% | 9,284 | 18% |
| Two | 8 | 10% | 606 | 1% |
| Three to Five | 32 | 38% | 7,774 | 15% |
| Six to Ten* | 6 | 7% | 30,770 | 60% |
| More than 10 | 1 | 1% | 2,570 | 5% |
| Grand Total | 84 | 100% | 51,004 | 100% |
* The BC portfolio under the six-to-ten lender category is substantially influenced by one trust with six lending partners and a BC portfolio of ₹28,551 crore.
As of 31 March 2026, 84 reporting MLIs were engaged in BC arrangements with one or more lending partners. Of these, 37 MLIs, representing 44% of the total, had an exclusive BC arrangement with one lender. These entities managed a combined BC portfolio of ₹9,284 crore, accounting for 18% of the total BC portfolio. A further eight MLIs were associated with two lenders, while 32 MLIs, or 38% of reporting MLIs, had partnerships with three to five lenders and managed a BC portfolio of ₹7,774 crore.
Overall, 47 MLIs, representing 56% of reporting MLIs, had BC arrangements with more than one lender. These multi-lender or hybrid BC entities accounted for ₹41,720 crore, or 82% of the aggregate BC portfolio, indicating the importance of diversified lender partnerships in BC-led credit delivery and reflecting their greater role in diversified, large-scale BC operations.
6.6 Portfolio under Co-Lending Model
Co-lending has emerged as an important partnership model through which banks and NBFCs can jointly fund loans while leveraging the sourcing, underwriting and servicing capabilities of partner institutions. In the microfinance ecosystem, co-lending may help improve access to lower-cost funding while ensuring that both partners retain a financial interest in the loan.
The RBI’s Co-Lending Arrangements Directions, 2025 became applicable from 1 January 2026 require each regulated entity to retain at least 10% of each loan under a co-lending arrangement, require a blended interest rate for the borrower, and require the respective loan shares to be reflected in both lenders’ books no later than 15 calendar days after disbursement.
Table 6.6: Co-lending portfolio of MLIs
| Legal Form | No. of MLIs engaged in Co-lending | Name of Banks/FIs in Co-lending Arrangement with MLIs | Total Portfolio under Co-lending Model (in ₹ Crore) | Out of Total, Co-lending share of Banks/FIs (in ₹ Crore) | Out of Total, Co-lending share MLI (in ₹ Crore) as of 31 March 2026 |
|---|---|---|---|---|---|
| NBFC-MFI | 9 | SIDBI, Axis Bank Ltd, State Bank of India, Karnataka Bank Ltd., Federal Bank Ltd., Canara Bank, Punjab National Bank, Indian Overseas Bank, MAS Financial Services Ltd., Piramal Finance Ltd. | 1,367 | 1,091 | 276 |
| NBFC | 2 | HDFC Bank, MAS Financial Services Ltd., Kisetsu Saison Finance Pvt. Ltd., Federal Bank Ltd., State Bank of India | 426 | 340 | 85 |
| Total | 11 | 1,792 | 1,431 | 361 |
The co-lending portfolio reported as of 31 March 2026 stood at ₹1,792 crore, involving 11 MLIs - nine NBFC-MFIs and two NBFCs. Of the total co-lending portfolio, NBFC-MFIs accounted for ₹1,367 crore, or about 76%, while the two NBFCs accounted for ₹426 crore, or about 24%. The arrangement involved a mix of public-sector banks, private-sector banks, SIDBI and NBFCs. Banks/FIs funded ₹1,431 crore, representing nearly 80% of the total co-lending portfolio, while the participating MLIs retained ₹361 crore, or about 20%, on their own books. The portfolio reflects the growing role of co-lending as a mechanism through which MLIs can access larger and relatively lower-cost funding pools while retaining a meaningful share of credit risk and responsibility for last-mile customer servicing.
Conclusion
The Business Correspondent model remains a critical bridge between regulated financial institutions and underserved customers. Its relevance has increased as lenders seek efficient and resilient means of providing last-mile credit while MLIs seek diversified partnership and funding models. The FY 2025-26 experience demonstrates that the BC model must evolve beyond a narrow focus on sourcing and collection towards a more accountable framework of responsible credit delivery, customer support, digital security and risk management.
A sustainable BC ecosystem will require collaboration among banks, Small Finance Banks, NBFCs, MLIs, technology partners, regulators and industry associations. The next phase of progress should be measured not only by the size of the BC portfolio or the number of partnerships, but also by the quality of customer outcomes, transparency of lending practices, operational resilience and contribution to inclusive financial development.
Box 6.1: Building a Resilient, Responsible and Technology-Enabled Microfinance Ecosystem
Muthoot Microfin Ltd (MML) is leveraging technology, digital innovation and robust governance frameworks to strengthen responsible lending, customer protection, operational resilience, efficiency and financial inclusion. Its approach combines technology and AI with human oversight, cybersecurity controls, employee capability and customer empowerment.
Cybersecurity & Operational Resilience
MML has strengthened its cybersecurity and operational risk framework through risk-based governance aligned with ISO/ISMS standards. Employee awareness programmes, phishing simulations, disaster recovery drills, incident-response mechanisms, third-party risk management and Continuous Threat Exposure Management (CTEM) support proactive identification and mitigation of emerging risks. These measures are aimed at strengthening business continuity, protecting critical systems and enhancing resilience against operational and cyber threats.
Technology-Enabled Lending & Operations
MML uses e-KYC, Face Match, e-Sign, customised credit scorecards, propensity models and digital applications to create a secure, efficient and largely paperless customer journey. An independent Credit Vertical strengthens governance by maintaining separation between credit decisions and business operations. AI-enabled underwriting for Individual and MSME loans analyses voice, images and documents to improve the consistency, speed, documentation and auditability of credit assessment, while retaining appropriate human oversight in decision-making.
Technology is also being used to improve operational efficiency, standardise processes and strengthen the quality and traceability of credit decisions across the lending lifecycle.
Digital Payments & Customer Empowerment
MML’s digital ecosystem integrates digital KYC, electronic documentation, digital signing and UPI-based payments, enabling customers to access services through more convenient and transparent channels. UPI-enabled collections are supporting greater adoption of digital repayments, improving transaction transparency and efficiency while reducing cash-handling risks. Its customer application enables customers to independently access financial information and undertake transactions, thereby promoting digital literacy, transparency, convenience and customer empowerment. The increased use of digital channels also supports better transaction records and reduces dependence on manual processes.
Data Privacy & Employee Capability
MML is strengthening data privacy and information security through cybersecurity controls, employee awareness initiatives and adherence to internal policies and compliance requirements. Given the increasing use of digital platforms and customer data, these measures are important for protecting sensitive information and maintaining customer trust.
Its evolving AI learning platform provides continuous digital training and AI-enabled support to field employees on customer protection, code of conduct, AML, cybersecurity, data privacy, grievance redressal and regulatory compliance. This enables employees to access relevant knowledge and guidance while strengthening awareness of responsible conduct and customer-centric practices.
Overall Impact
These initiatives reflect MML’s approach to responsible digital transformation, where technology and AI are supported by strong governance, human oversight, cybersecurity, data protection and continuous employee capability building. Together, these measures contribute to a more resilient, secure, efficient, inclusive and customer-centric microfinance ecosystem, while supporting responsible growth and improved customer experience.