


Chapter 4 - Section 4.1Productivity of Workforce
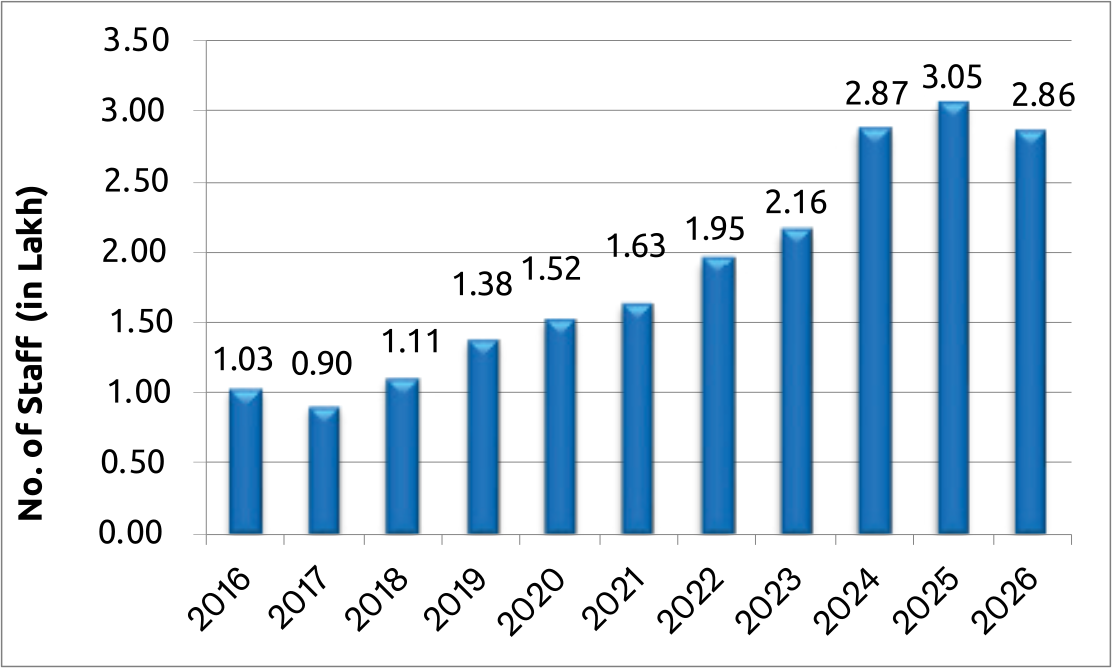
In line with the sector’s guided deceleration, we observed a contraction in the workforce, from 3.05 lakh in FY2024-25 to 2.86 lakh in FY2025-26. The new recruitment eased, from 2.06 lakh new hires to 1.53 lakh. This aligns with the sector’s overall deceleration, with the portfolio level declining by 11%.


Chapter 4: Section I
Operational Eminence of Micro Lending Institutions
4.1 Productivity of Workforce:
4.1.1 Workforce in MLIs
In line with the sector’s guided deceleration, we observed a contraction in the workforce, from 3.05 lakh in FY2024-25 to 2.86 lakh in FY2025-26. The new recruitment eased, from 2.06 lakh new hires to 1.53 lakh. This aligns with the sector’s overall deceleration, with the portfolio level declining by 11%.
Although the staff numbers have reduced, the borrowers per staff member held almost steady at 195, essentially unchanged from last year, showing that overall service capacity per employee has been preserved even as the workforce itself got leaner.
A smaller, more deliberately built workforce, hired more selectively, with ABS holding firm, suggests MLIs are prioritising the right people over sheer headcount, which typically follows periods of rapid growth. Digitisation, along with AI-enabled tools, has already begun reshaping employees’ workflows. The flat ABS trend is consistent with technology helping hold the line on overall productivity even as workforce count fell.
Staff strength stood at 2.86 lakh in 2026, down about 6% from the peak of 3.05 lakh in 2025. This moderation likely reflects workforce rationalisation and operational consolidation following the rapid expansion seen in 2024–25. Slower portfolio growth, tighter underwriting and responsible lending practices, and greater adoption of digital processes and technology-enabled collections and customer servicing may have reduced the need for additional field-level manpower. The moderation also coincides with easing input costs for lenders; inflation has stayed comfortably within the RBI’s target range through FY2025-26, allowing institutions to prioritise balance-sheet repair and workforce efficiency over aggressive branch and headcount expansion. Despite the decline, the workforce remains significantly higher than in earlier years, indicating continued operational capacity across the sector.
Figure 4.1.1: Number of MLI staff – Yearly trend and MLI-category-wise Break-up of current year
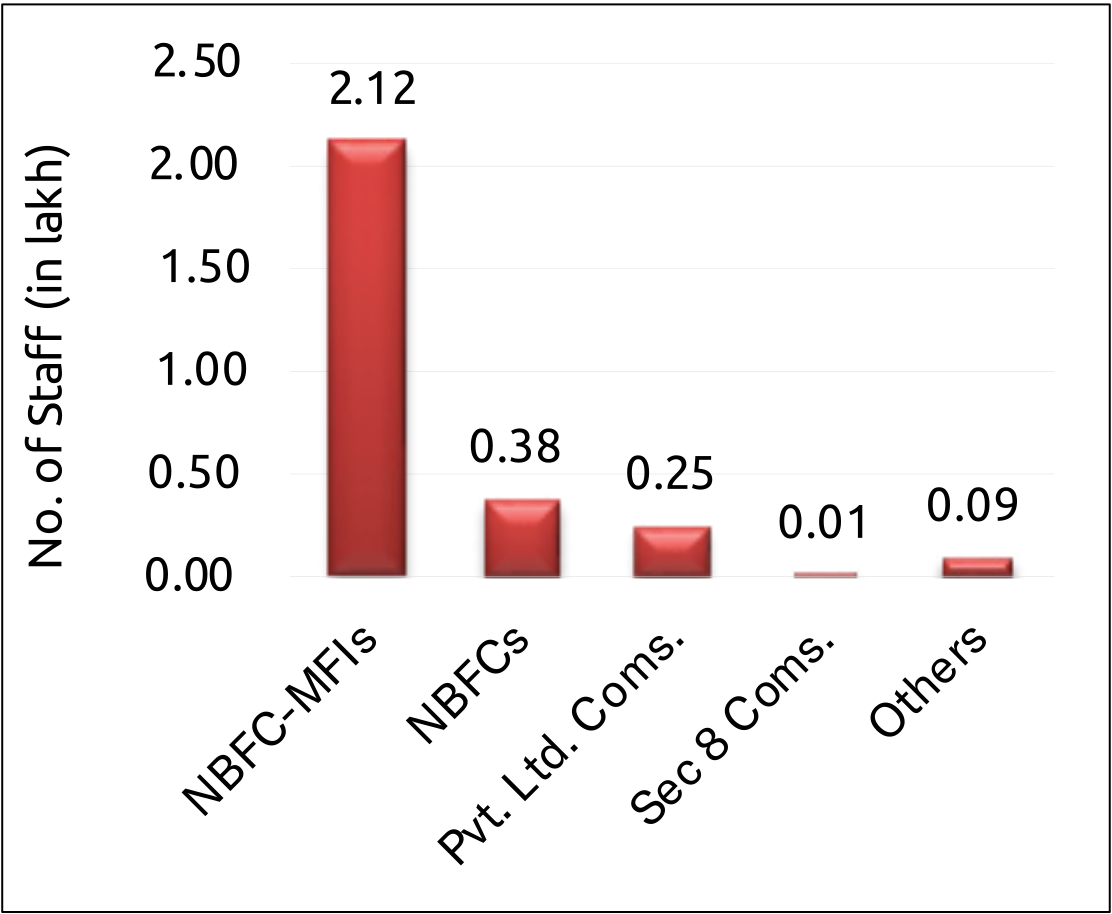
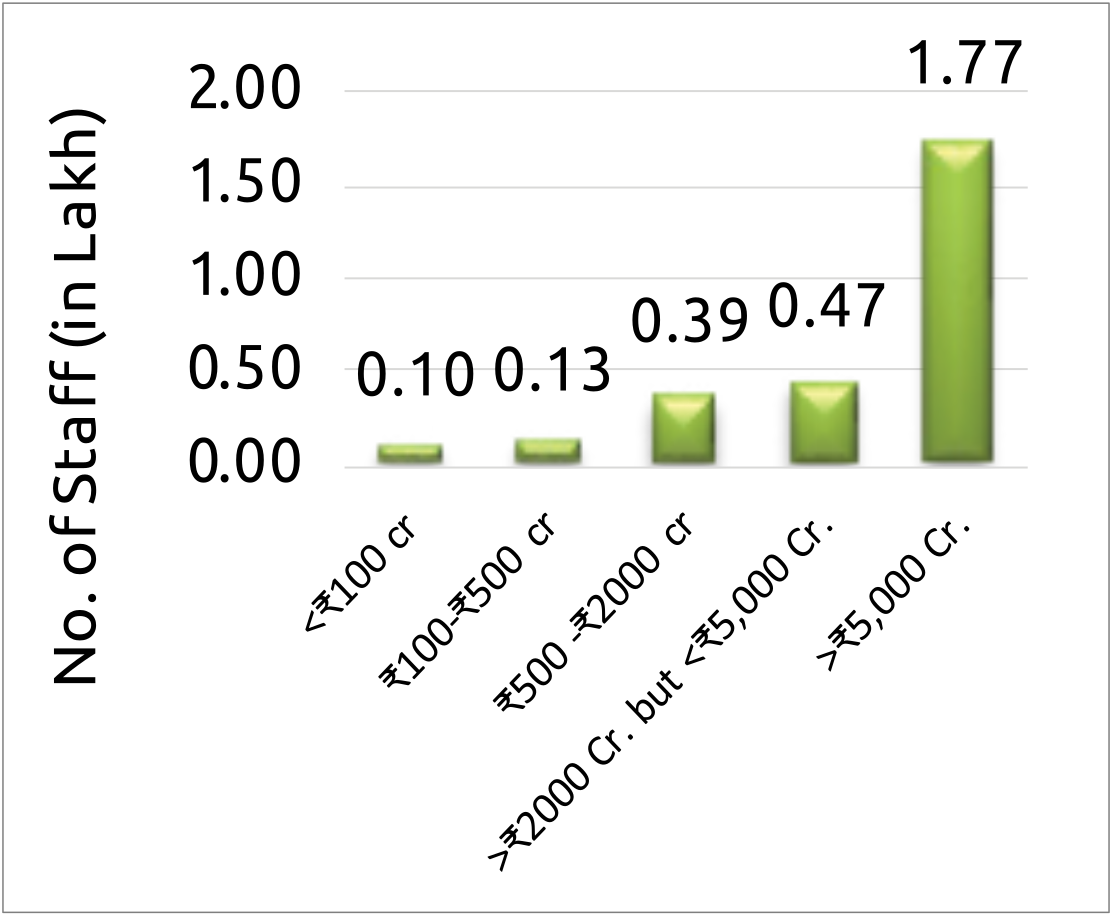
Among MLIs, in 2026, staff strength is predominantly concentrated among NBFC-MFIs, which account for 2.12 lakh staff, far exceeding NBFCs (0.38 lakh), private limited companies (0.25 lakh), and other lender categories. Within NBFC-MFIs, larger institutions employ a much larger share of the workforce: institutions with a ₹2,000–5,000 crore portfolio account for 0.47 lakh staff, followed by those with ₹500–2,000 crore at 0.39 lakh. Smaller institutions employ fewer staff, suggesting that workforce size closely aligns with institutional scale and portfolio size. At the macro level, this concentration of employment within NBFC-MFIs and larger institutions mirrors the wider formalisation of India’s financial system1. While larger lenders benefit from economies of scale and can support more structured employment, this also underscores the need to ensure that smaller MFIs remain financially sustainable and operationally viable, particularly as the sector focuses on cost efficiency and digital transformation. Overall, a large and skilled workforce continues to underpin financial inclusion, employment generation, and last-mile delivery of financial services, particularly in rural and underserved markets that remain outside the reach of mainstream banking.
As the sector evolves toward more responsible and efficient lending, changes in workforce size and composition offer important insights into microfinance institutions’ operational priorities — and, by extension, into the health of last-mile credit delivery across the wider economy. The following analysis examines the overall staff strength, distribution across lender categories and institution sizes, and the changing composition of frontline and support staff in 2026.
1 Based on the self-reported data of MLIs.
Figure 4.1.2: Distribution of staff in the last two years
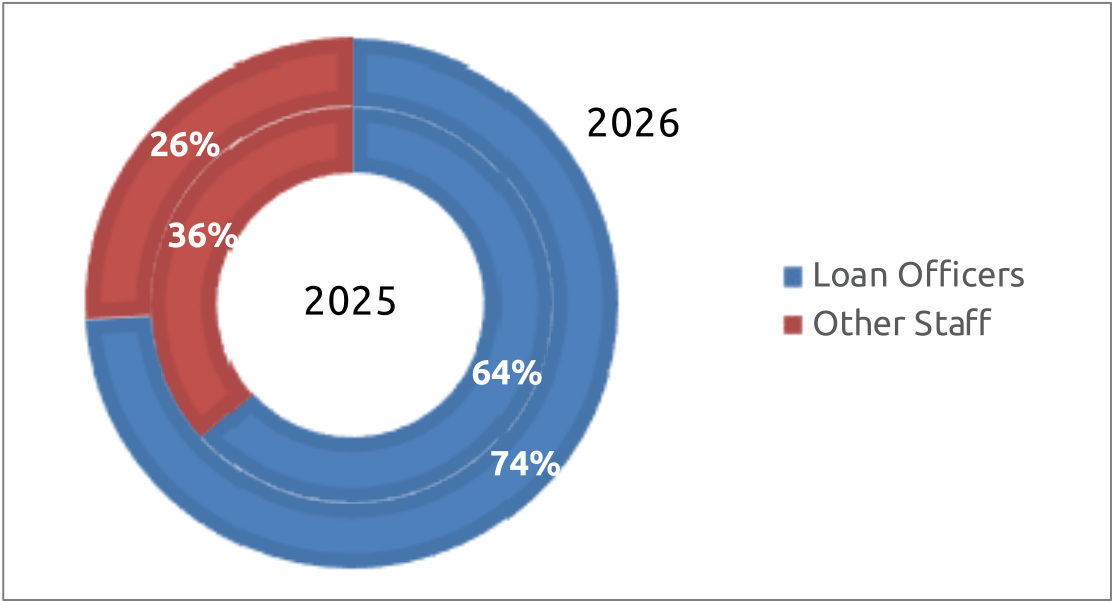
The workforce composition shows a clear shift towards Loan Officers (field officers), whose share increased from 64% in 2025 to 74% in 2026, while the share of other staff declined from 36% to 26%. This points to a more efficient utilization of manpower with focus on field-level lending and customer-facing operations, consistent with the sector’s growing emphasis on credit monitoring, collections, borrower engagement and responsible lending. The shift also indicates a rationalisation of support functions and greater operational efficiency through technology and digitalisation — institutions are visibly prioritising frontline roles that directly support portfolio management and customer outreach over back-office headcount, a pattern that aligns with the Usage-led rise in the RBI’s national Financial Inclusion Index this year.
Women’s participation in the microfinance workforce is an important indicator of the sector’s contribution to inclusive employment and gender diversity. Given the sector’s strong focus on women borrowers and community-level engagement, women’s presence in the workforce is particularly relevant — and worth reading against the national trend, where female labour force participation has been rising steadily. The following analysis examines the trend in women’s employment and their share of total staff strength over the years, with a focus on developments in 2026.
Table 4.1.1: Year-wise staff strength in MLIs and share of women staff
| Year | Total Staff (in lakh) |
Women Staff (in lakh) |
% of Women Staff to Total Staff |
|---|---|---|---|
| 2016 | 1.03 | 0.16 | 15% |
| 2017 | 0.90 | 0.11 | 12% |
| 2018 | 1.11 | 0.13 | 12% |
| 2019 | 1.38 | 0.16 | 12% |
| 2020 | 1.52 | 0.17 | 11% |
| 2021 | 1.63 | 0.17 | 10% |
| 2022 | 1.95 | 0.25 | 13% |
| 2023 | 2.16 | 0.26 | 12% |
| 2024 | 2.87 | 0.31 | 11% |
| 2025 | 3.05 | 0.31 | 10% |
| 2026 | 2.86 | 0.31 | 11% |
The data indicate that women’s participation in the microfinance workforce has remained relatively stable in absolute terms but has declined as a share of total employment over the longer term. Women staff increased from 0.16 lakh in 2016 to 0.31 lakh in 2026, while their share of total staff declined from 15% in 2016 to 11% in 2026, reaching a low in the share of 10% in 2025. In 2026, despite an overall reduction in staff strength from 3.05 lakh to 2.86 lakh, the number of women staff remained unchanged at 0.31 lakh, lifting their share back up to 11%. This suggests that women’s attrition has been relatively low and their recruitment has also been stagnant. In other words, for the last 3 years, the number has been almost stable at 0.31 lakh, indicating there has not been much expansion in their strength in microfinance. This is in contrast with the MoSPI’s Periodic Labour Force Survey, which shows the rural female labour force participation rate stood at 45.9% in 2025. For a sector whose entire lending model is built around women borrowers, expanding women’s presence in frontline and managerial roles would not only align the workforce more closely with the client base but also provide better business sense to micro lenders.
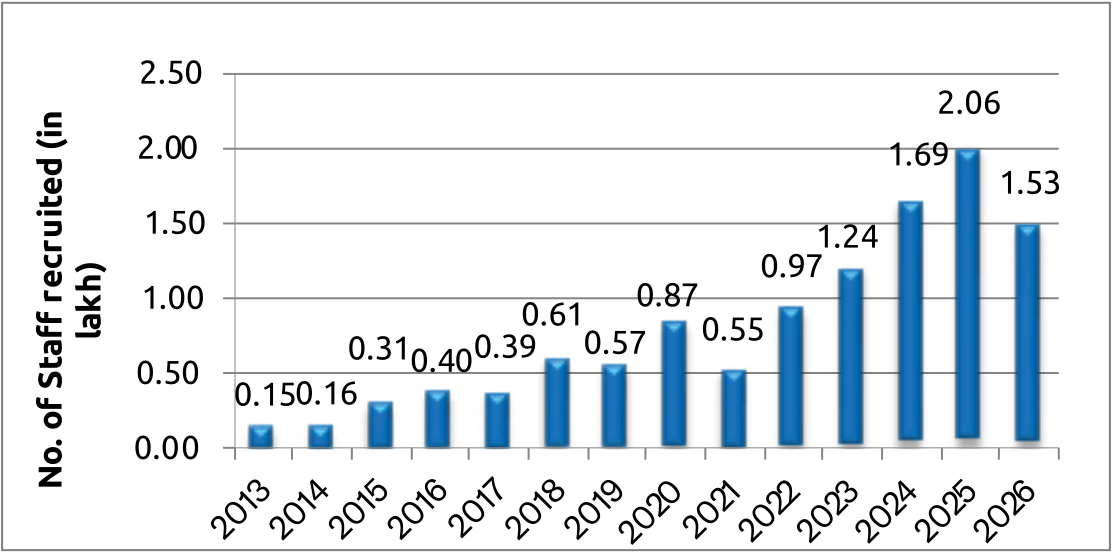
Staff recruitment in the microfinance sector has shown a strong overall upward trend over the past decade, although with periodic fluctuations that broadly track the sector’s own credit cycle. Recruitment increased from just 0.15 lakh in 2013 to 0.40 lakh in 2016, before rising significantly to 0.61 lakh in 2018. After a temporary moderation in 2019, recruitment reached 0.87 lakh in 2020, then fell to 0.55 lakh in 2021, largely reflecting pandemic-related operational and business disruptions. Recruitment subsequently recovered strongly, increasing from 0.97 lakh in 2022 to 1.24 lakh in 2023, and accelerated further to 1.69 lakh in 2024 and 2.06 lakh in 2025.
The sharp increase between 2023 and 2025 is consistent with the sector’s expansion in portfolio, customer outreach and operational footprint, alongside greater staffing requirements for field operations, collections, credit assessment, customer servicing and compliance. This period also coincided with a strong national growth cycle — real GDP grew 6.5% in FY2024-25 — which supported buoyant credit demand and gave MLIs the confidence to scale up staffing well ahead of the eventual correction. Strong recruitment during this period may also reflect institutions rebuilding and strengthening their workforce following pandemic-related disruptions.
In 2026, recruitment moderated to 1.53 lakh, down by about 26% from the previous year’s peak. This reduction appears consistent with the deceleration of business observed in 2026, driven by slower portfolio growth, tighter lending practices, branch and workforce rationalisation, and increased use of digital technologies in lending and collections.
Figure 4.1.3: New Staff Recruitment and their break-up based on Legal Form and Size
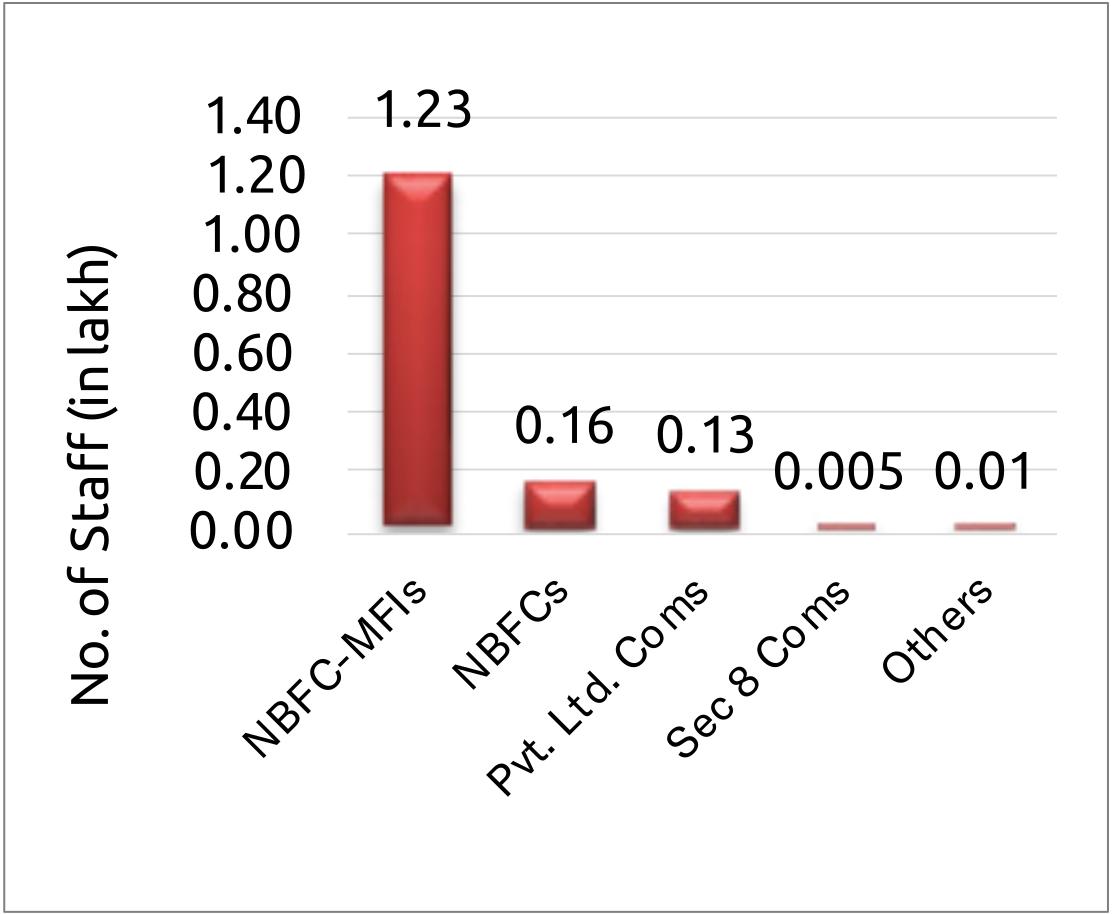
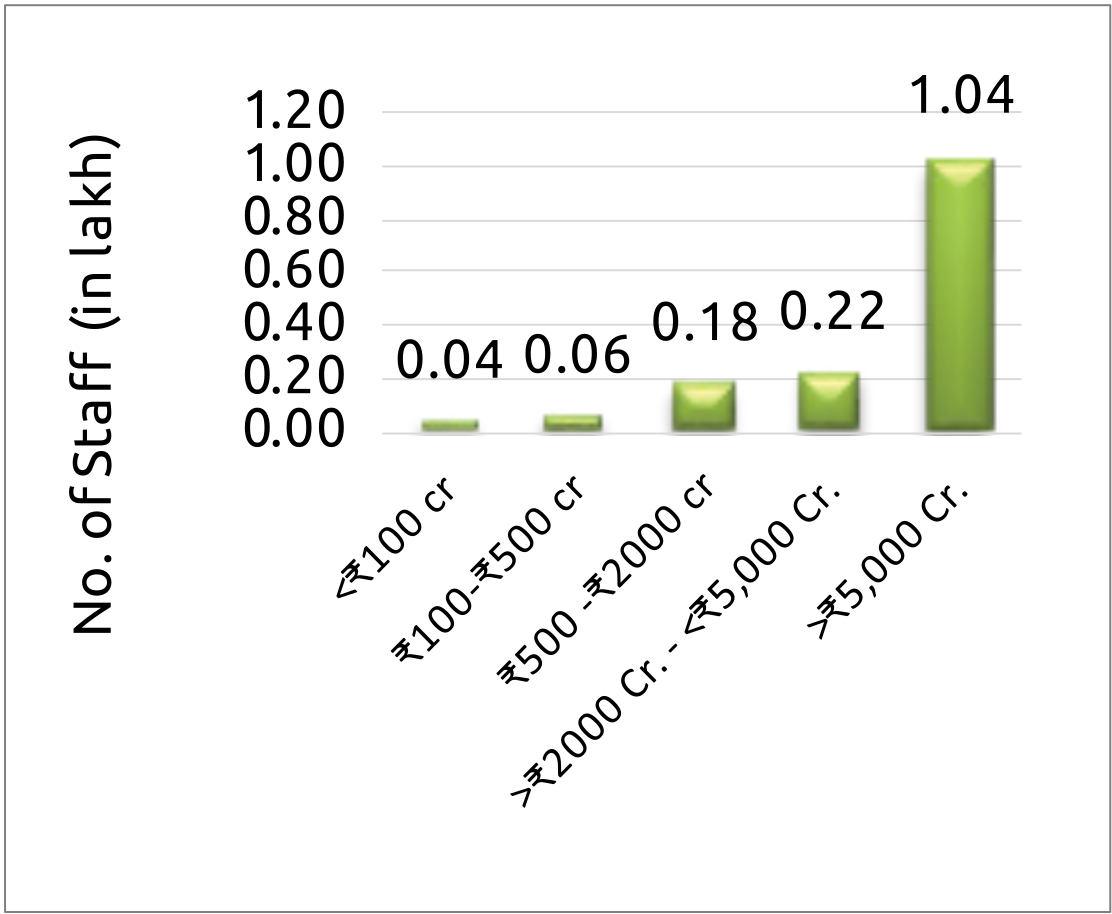
In FY2025-26, staff recruitment was heavily concentrated among NBFC-MFIs, which accounted for 1.23 lakh of the 1.53 lakh total recruits. Recruitment was particularly strong among larger institutions, with entities having portfolios above ₹5,000 crore accounting for 1.04 lakh recruits, substantially higher than smaller portfolio-size categories. This concentration reflects the greater scale of operations and workforce requirements of large NBFC-MFIs, and reinforces a broader pattern visible across the year: employment generation in the sector is increasingly a function of institutional scale rather than sector-wide growth, with smaller institutions contributing relatively modestly to overall employment generation during the year.
As seen in the previous years, in 2025–26 staff movement indicates considerable workforce churn across the microfinance sector, with 1.72 lakh staff exiting as against 1.53 lakh new recruits, resulting in a net decline of around 19,000 staff during the year. Attrition was particularly pronounced among NBFC-MFIs, which accounted for nearly 81% of total staff exits, while recruitment also remained concentrated in this segment. By business size, the largest institutions (portfolios above ₹5,000 crore) recorded the highest employee movement, with over 1.02 lakh exits and 1.04 lakh new recruits; recruitment marginally exceeded exits, however, resulting in a net addition of around 1,400 staff. In contrast, institutions in the ₹2,000–5,000 crore category saw a notable workforce reduction, as exits substantially exceeded new recruitment. Overall, the data suggest that 2025–26 was a year of workforce rationalisation and restructuring, with larger institutions largely maintaining their workforce through replacement hiring, while smaller and mid-sized institutions experienced greater net reductions — a bifurcation that echoes the broader consolidation pattern visible across India’s NBFC space, where scale and access to capital have increasingly determined which institutions can absorb stress without shedding jobs.
Table 4.1.2: Staff Attrition across different categories during FY 2025-26
| Categories of institutions based on legal status and size of business | No. of staff at the beginning of the year (i.e., April’25) | No. of staff who left/dropped during the year. | No. of new Staff recruited during the year | No. of staff at the end of the year |
|---|---|---|---|---|
| (i.e. March 26) | ||||
| Staff Attrition across Legal Form of MLIs | ||||
| NBFC-MFIs | 2,28,679 | 139179 | 122693 | 2,12,193 |
| NBFCs | 37,655 | 15661 | 16216 | 38,210 |
| Pvt. Ltd. Coms | 27,550 | 15426 | 12849 | 24,973 |
| Sec. 8 Coms | 1,300 | 630 | 480 | 1,150 |
| Other NGO-MFIs | 9,815 | 922 | 556 | 9,449 |
| Total | 3,04,999 | 1,71,818 | 1,52,794 | 2,85,975 |
| Staff Attrition across Size of MLIs | ||||
| <₹100 Cr. | 13,595 | 7,000 | 3,644 | 10,239 |
| ₹100 Cr.- ₹500 Cr. | 13,723 | 6,666 | 5,634 | 12,691 |
| ₹500 Cr. – ₹2000 Cr. | 42,350 | 21,342 | 17,833 | 38,841 |
| >₹2000 Cr. - <₹5,000 Cr. | 59,481 | 34,601 | 22,087 | 46,967 |
| >₹5,000 Cr. | 1,75,850 | 1,02,209 | 1,03,596 | 1,77,237 |
| Total | 3,04,999 | 1,71,818 | 1,52,794 | 2,85,975 |
4.1.2 Staff Productivity
Staff productivity remains an important measure of the operational efficiency, cost-effectiveness and service delivery capacity of microfinance institutions. Given the sector’s field-intensive operating model, institutions must effectively manage their workforce while maintaining meaningful engagement with borrowers to support both portfolio quality and institutional sustainability. Productivity is particularly relevant in the current environment, where lenders are increasingly balancing responsible lending, tighter credit assessment, portfolio monitoring and cost optimisation with the need to maintain last-mile outreach. It is also a useful lens on the sector’s contribution to national financial inclusion goals: the RBI’s Financial Inclusion Index rose to 70.0 in March 2026, with the Usage sub-index driving most of the gain, and how efficiently MLI staff can serve borrowers has a direct bearing on how quickly that usage gap continues to close.
The borrower-to-staff and borrower-to-credit officer ratios provide useful indicators of how institutions deploy their workforce. A higher ratio may indicate greater workforce efficiency and economies of scale, but if it becomes excessive, it can place pressure on credit assessment, borrower interaction, collection practices and customer service. Conversely, a lower ratio may imply greater staff intensity and closer borrower engagement, although it may also raise operating costs. Striking an appropriate balance between productivity and service quality is therefore essential — and carries implications well beyond any single institution’s cost structure, since it shapes the quality and depth of financial inclusion for millions of low-income borrowers.
For client-to-staff ratios, 32% of institutions report fewer than 100 clients per staff member, while the largest group, 45%, falls in the 100–200 client range. A further 15% have between 200 and 300 clients per staff member. In all, 92% of institutions have fewer than 300 clients per staff member, suggesting that most institutions maintain a reasonably intensive staff structure for customer servicing, field operations,portfolio monitoring and collection efforts. Only a small proportion operate with higher workloads: 2% report 300–400 clients and 6% more than 400 clients per staff member. These higher ratios may reflect greater branch-level efficiency, larger operational scale, or increased use of digital and technology-enabled processes.
Figure 4.1.4 Distribution of MLIs based on clients served per Staff and Credit Officer
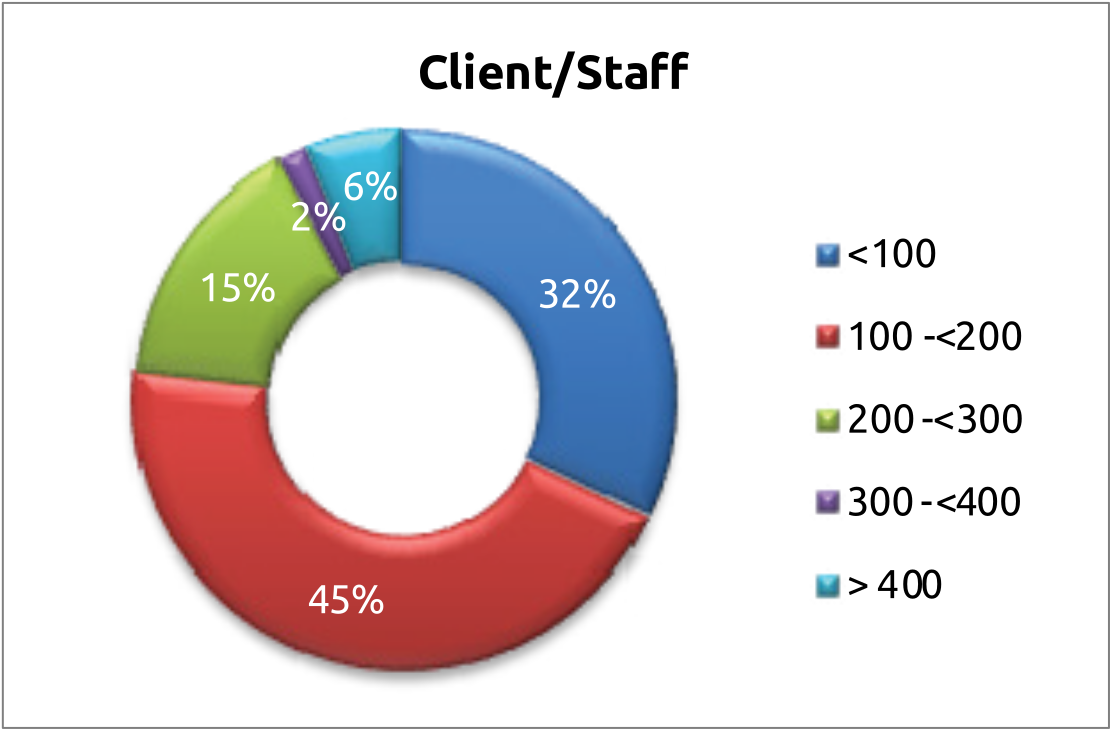
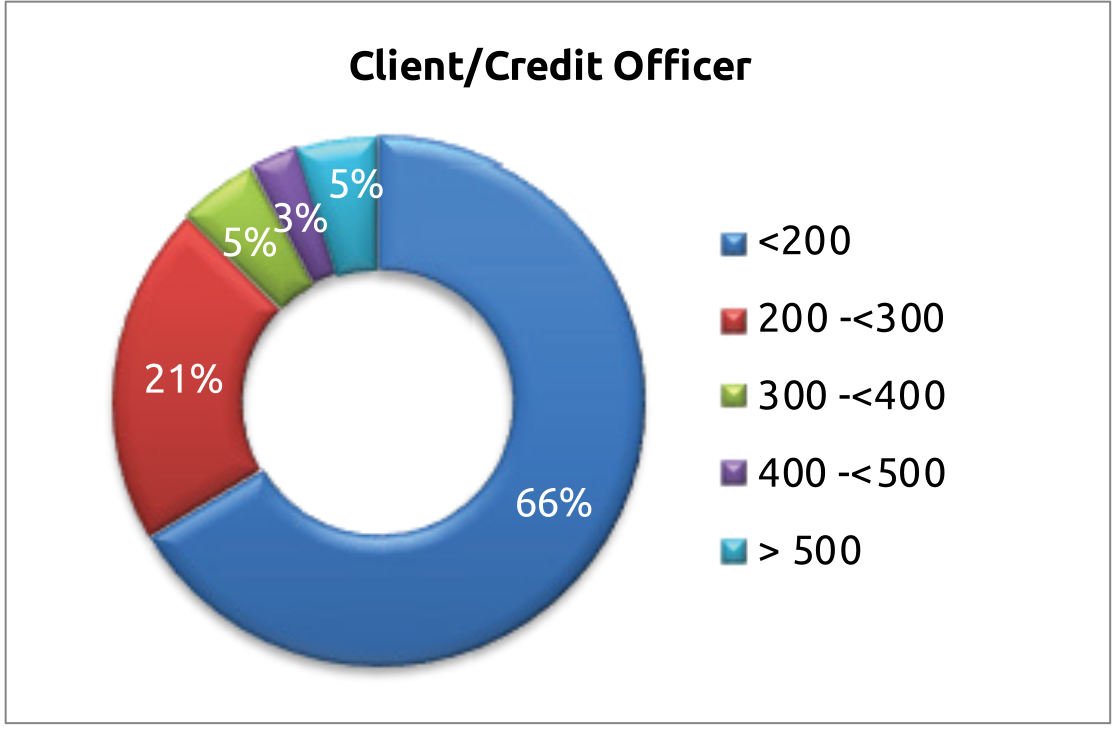
The borrower-to-credit officer ratio is comparatively higher, with 66% of institutions having fewer than 200 clients per credit officer and another 21% in the 200–300 range. As a result, 87% of institutions have fewer than 300 clients per credit officer. However, 5% report 300–400 clients, 3% between 400 and 500, and 5% more than 500 clients per credit officer. This suggests that while frontline credit functions remain relatively well staffed across most institutions, a small segment is operating with significantly higher workloads that merit closer monitoring for borrower protection.
Overall, the ratios indicate a predominantly field-intensive operating model, with institutions maintaining substantial staff engagement relative to their client base. At the same time, higher client loads at some institutions point to operational efficiencies and increasing digitalisation, particularly among larger institutions. Maintaining an appropriate balance will remain important as lenders seek to improve productivity while ensuring quality customer engagement, responsible lending, effective collections and borrower protection.
Figure 4.1.5: Trends of ABCO Across MLIs and break-up of 2026 in terms of Legal Form and Size
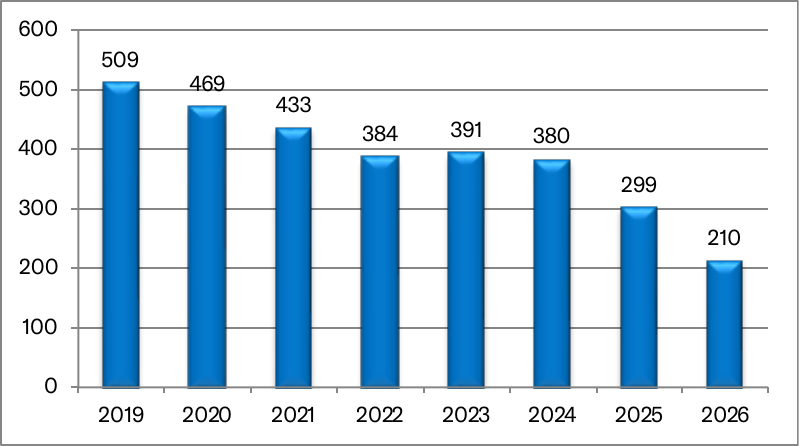
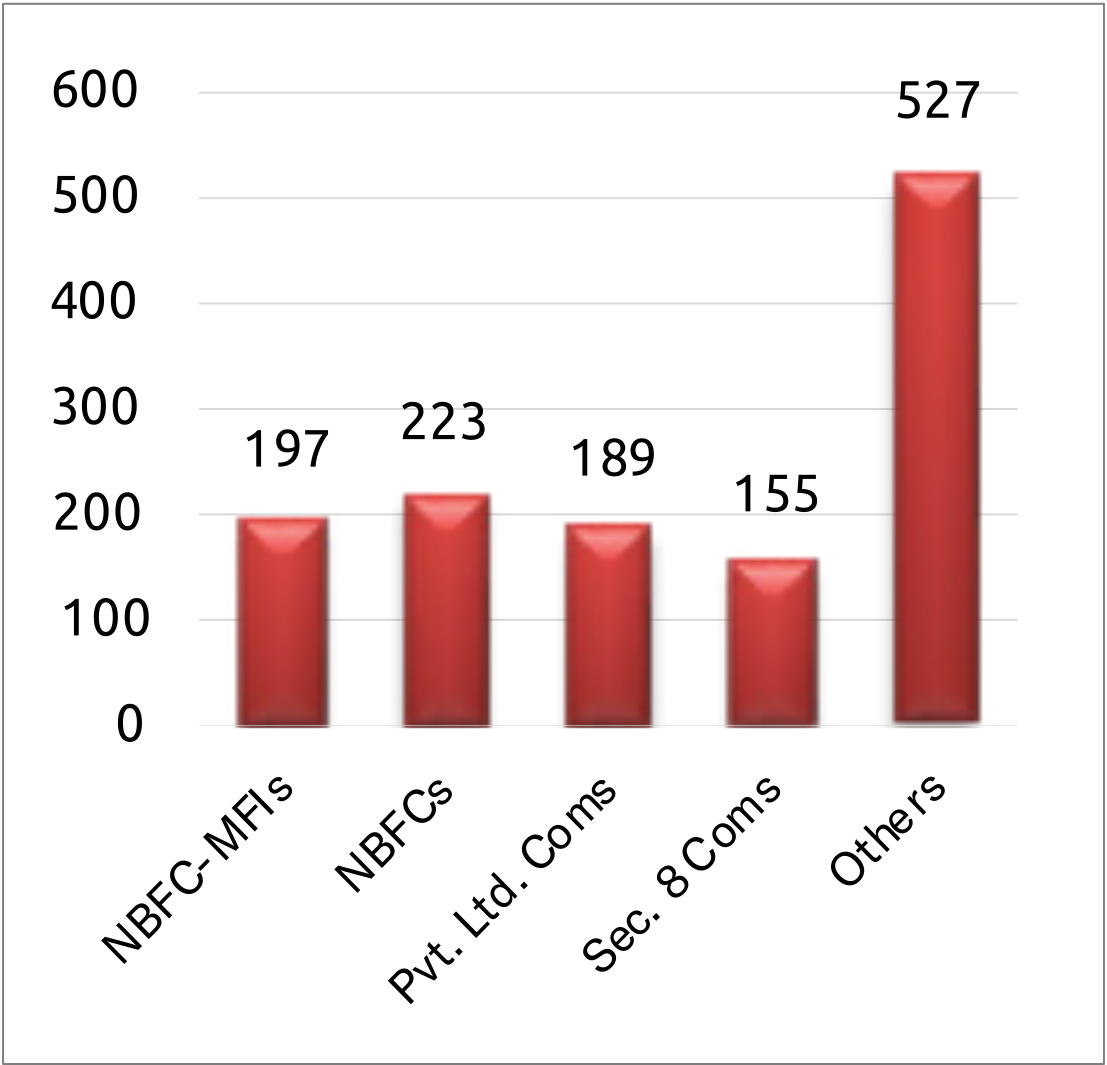
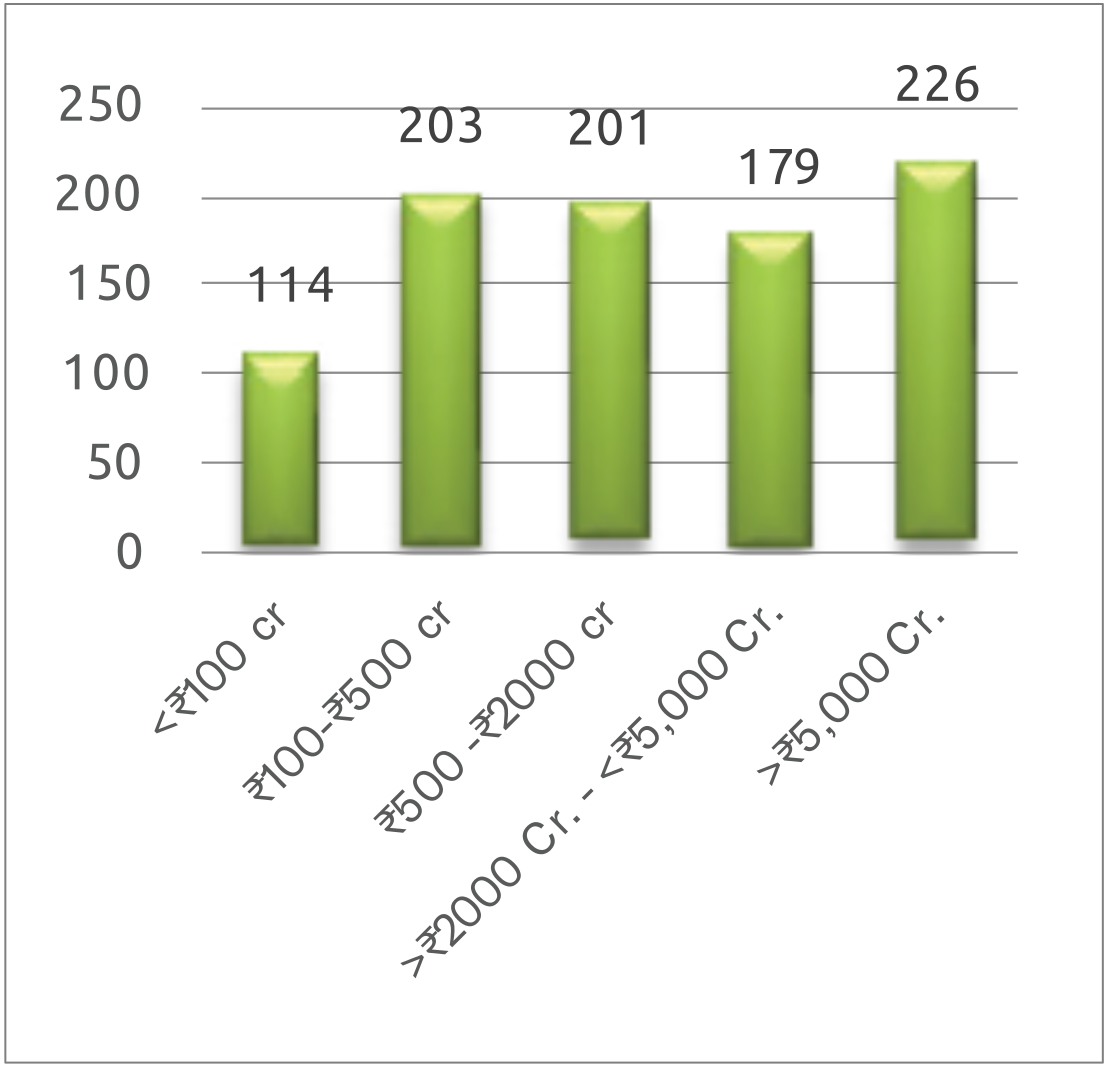
The chart shows a clear and sustained shift in staff productivity, measured by the number of clients served per credit officer, over 2019–2026. The ratio declined from 509 clients per credit officer in 2019 to 384 in 2022, before a brief uptick to 391 in 2023. It then fell further to 380 in 2024, 299 in 2025 and 210 in 2026. The steepest decline came in the last two years, with the ratio falling by nearly 21% in 2025 and 30% in 2026, leaving the 2026 level at less than half of the 2019 figure. This can be also attributed to weakening of group concept with more and more individualized lending happening in microfinance sector.
Figure 4.1.6: Trends of ABS Across MLIs and break-up of 2026 in terms of Legal Form and Size
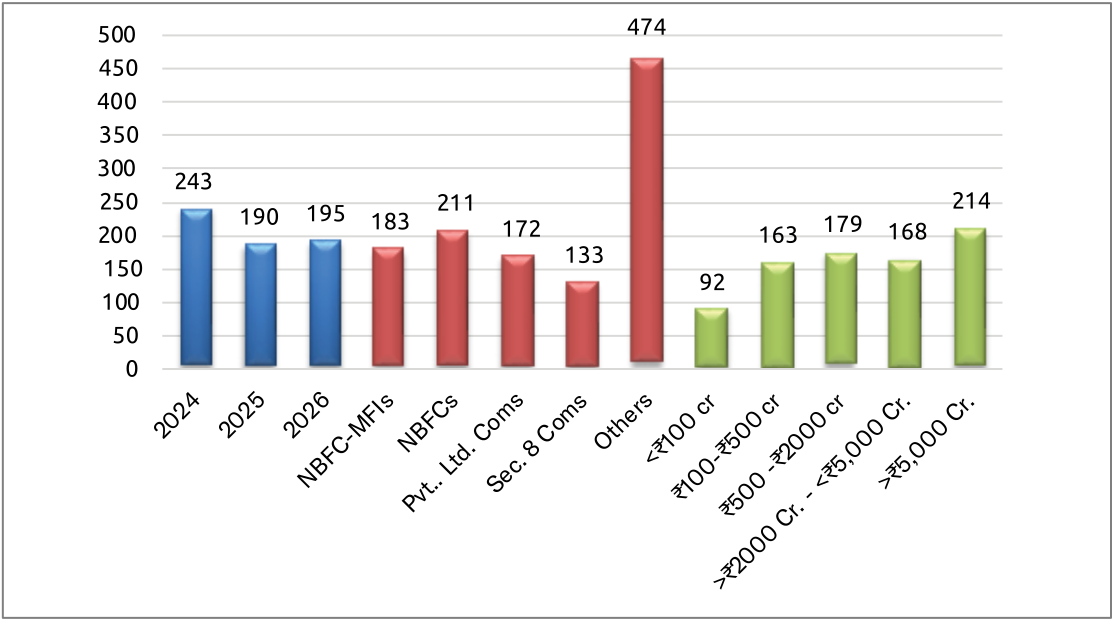
This trend suggests institutions are deploying more staff per client than at any point in the last several years — a pattern consistent with greater emphasis on responsible lending, closer borrower engagement, credit assessment, collections and portfolio monitoring.
4.1.3 Distribution of MLIs Based on Loan Portfolio per Credit Officer
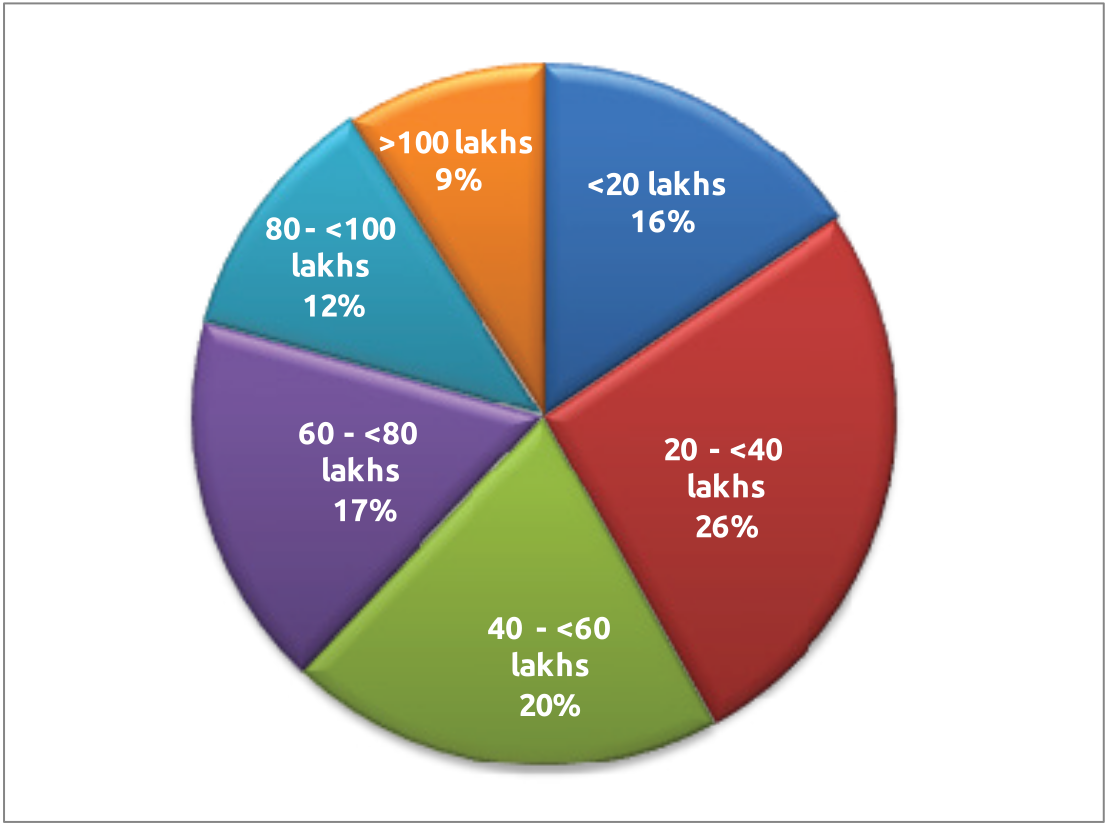
The distribution of institutions by portfolio size points to a diverse institutional landscape, with organisations spread across markedly different scales of operation. The largest proportion, 26%, falls within the ₹20–40 lakh portfolio category, followed by 20% in the ₹40–60 lakh category. A further 17% of institutions are in the ₹60–80 lakh range, while 12% have portfolios between ₹80–100 lakh. At the upper end, 9% of institutions have portfolios exceeding ₹100 lakh, indicating a sizeable group of relatively large institutions. At the lower end, 16% operate with portfolios below ₹20 lakh, highlighting the continued presence of smaller institutions in the sector.
Figure 4.1.7: Distribution of MLIs Based on Loan Portfolio per Credit Officer
Conclusion
The analysis of the microfinance sector’s institutional and workforce profile in 2026 highlights a sector undergoing significant consolidation, restructuring and operational transition. While overall staff strength moderated from the previous year’s peak, the sector maintained a substantial workforce, underscoring the continuing importance of human resources in sustaining last-mile financial inclusion even as national credit and consumption indicators stayed resilient.
At the same time, high staff exits and moderated recruitment point to workforce rationalisation as institutions respond to slower portfolio growth, tighter lending practices and the need for greater operational efficiency. This rationalisation is occurring even as the broader interest-rate and inflation environment has turned more favourable. The changing workforce composition, particularly the higher share of loan officers, points to a continued focus on frontline credit delivery, portfolio monitoring, collections and borrower engagement. The declining client-to-staff ratio further indicates a shift towards a more staff-intensive operating model, potentially supporting stronger customer engagement and more responsible lending practices.
The data also highlight the continuing scope to strengthen women’s participation in the workforce, particularly as the sector remains predominantly focused on women borrowers; at 11%, the sector’s women-staff share sits well below the 45.9% rural female labour force participation rate recorded nationally in 2025, a gap that represents both an equity concern and an underused source of talent as the sector rebuilds its frontline capacity. Overall, the sector appears to be moving from a phase of rapid expansion towards more disciplined, productivity-conscious and technology-enabled growth — a shift that, if sustained, should leave MLIs better placed to participate in India’s continuing credit and consumption upcycle without repeating the over-expansion of 2023–25. Institutions’ ability to balance workforce efficiency with service quality, employee retention, borrower protection, gender diversity and sustainable outreach will remain central to the sector’s evolution, and to its contribution to the country’s wider financial inclusion and inclusive-growth agenda.