


Chapter 4 - Section 4.4 - SubSection 4.4.2Operational Self-Sufficiency (OSS)
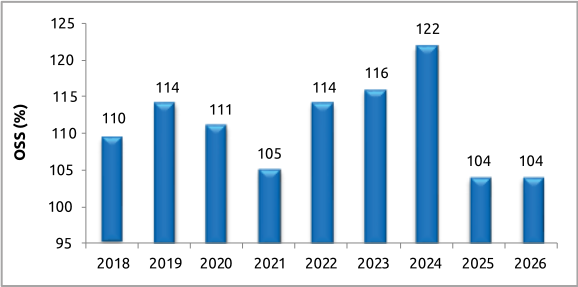
Operating efficiency remains an important consideration for MLIs as the institutions balance the need to maintain outreach and service delivery with the requirement to manage costs sustainably. In FY2025-26, the Operational Self-Sufficiency (OSS) ratio stood at 104%, indicating that operating income was sufficient to cover operating expenses, with a modest surplus of income over expenses. The past trend recorded a gradual strengthening of operating efficiency over the period of time, with the OSS ratio moving from 110% in 2018 to a peak of 122% in 2024, before moderating to 104% in both 2025 and 2026. As the business improves, we may see a better OSS ratio in the future. But the ratio remaining above 100% indicates that MLIs continued to maintain operational self-sufficiency. The moderation suggests that the sector’s operating income has remained adequate to meet its operating cost base, even as cost pressures have persisted. Going forward, maintaining this positive margin will depend on institutions’ ability to improve productivity, manage operating costs and sustain adequate income generation, particularly in an environment where growth is moderating and the underlying cost base remains relatively elevated.


Average OSS of MLIs over the years
Average OSS of MLIs - Category Wise
Average OSS of MLIs - Size Wise
OSS based on average loan outstanding per borrower
OSS based on yield category
4.4.2 Operational Self-Sufficiency (OSS2)
Operating efficiency remains an important consideration for MLIs as the institutions balance the need to maintain outreach and service delivery with the requirement to manage costs sustainably. In FY2025-26, the Operational Self-Sufficiency (OSS) ratio stood at 104%, indicating that operating income was sufficient to cover operating expenses, with a modest surplus of income over expenses. The past trend recorded a gradual strengthening of operating efficiency over the period of time, with the OSS ratio moving from 110% in 2018 to a peak of 122% in 2024, before moderating to 104% in both 2025 and 2026. As the business improves, we may see a better OSS ratio in the future. But the ratio remaining above 100% indicates that MLIs continued to maintain operational self-sufficiency. The moderation suggests that the sector’s operating income has remained adequate to meet its operating cost base, even as cost pressures have persisted. Going forward, maintaining this positive margin will depend on institutions’ ability to improve productivity, manage operating costs and sustain adequate income generation, particularly in an environment where growth is moderating and the underlying cost base remains relatively elevated.
2 OSS = (Total Income/Total Expenses) x100
Figure 4.4.1: Average OSS of MLIs over the years and its break-up between various categories
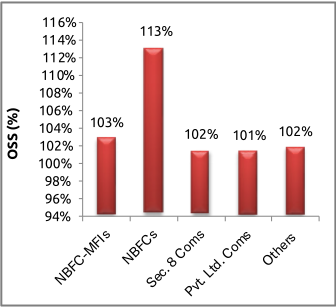
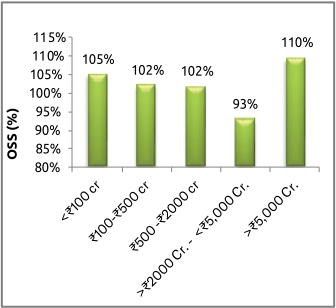
Across legal forms, the ratio was highest among NBFCs at 113%, followed by NBFC-MFIs at 103%, Section 8 Companies and Others at 102%, and Pvt. Ltd. Companies at 101%. By institution size, the ratio was highest among MLIs with AUM above ₹5,000 crore at 110%, while institutions with AUM between ₹2,000–₹5,000 crore recorded the lowest ratio at 93%. Variation across institution types and sizes suggests that operating efficiency depends not only on scale but also on institutions’ underlying cost structures and business models. The lower ratio among the ₹2,000–₹5,000 crore segment points to comparatively stronger cost absorption. Overall, the data highlights the need for continued cost optimisation and productivity improvements, particularly among institutions where operating expenses remain higher than operating income.
Analysing OSS against average loan outstanding per borrower is important for understanding how changes in loan size relate to the operating efficiency of MLIs. As loan sizes increase, institutions may benefit from economies of scale, which result in higher income per borrower. Examining this relationship therefore helps assess whether larger average loan sizes are translating into greater operating efficiency and better absorption of operating costs, and provides insight into the sustainability of different lending models.
Figure 4.4.2: OSS based on average loan outstanding per borrower
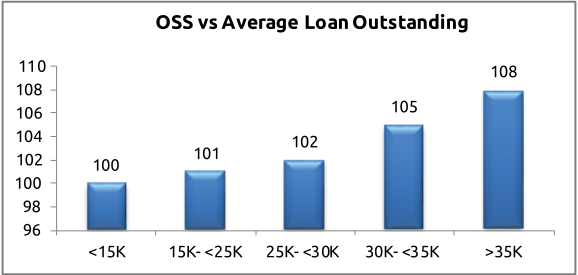
In FY2025-26, the Operating Self-Sufficiency (OSS) ratio showed a clear relationship with average loan outstanding, increasing progressively as average loan outstanding rose. MLIs with an average loan outstanding of less than ₹15,000 recorded an OSS ratio of 100%, while the ratio increased to 101% for ₹15,000–₹25,000, 102% for ₹25,000–₹30,000, 105% for ₹30,000–₹35,000 and 108% for loans above ₹35,000. Since OSS measures how much operating income covers operating expenditure, the rising ratio indicates that institutions with larger average loan sizes generated relatively higher operating income relative to their operating expenses. This may reflect greater income generation per borrower or loan account, improved revenue absorption of operating costs, and differences in portfolio composition and operating models. The trend suggests that higher average loan sizes were associated with stronger operating self-sufficiency, although the relationship may also reflect differences in pricing, portfolio quality, productivity, and institutional scale.
Analysing OSS against portfolio yield helps assess how effectively operating income from the portfolio translates into coverage of operating expenditure. Because OSS reflects an institution’s ability to meet operating expenses through operating income, a higher ratio indicates stronger operating self-sufficiency. Examining this relationship therefore helps determine whether higher portfolio yields are associated with greater income coverage of operating costs and whether institutions at different yield levels can maintain sufficient operating income to support ongoing operations.
Figure 4.4.3: OSS based on yield category
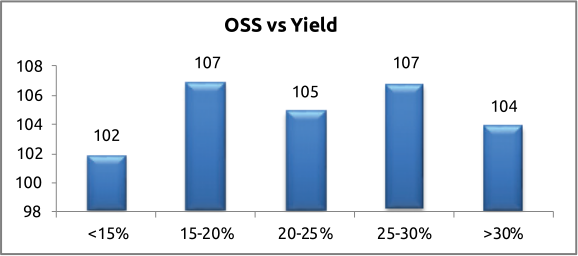
In FY2025-26, the OSS ratio remained above 100% across all yield categories. It was 102% for MLIs with yield below 15%, increased to 107% for the 15–20% yield category, and moderated slightly to 105% for 20–25%. The ratio then rose to 107% for 25–30% yield before falling to 104% among MLIs with yields above 30%. The pattern does not show a linear relationship between yield and operating efficiency, suggesting that higher portfolio yield by itself does not necessarily translate into proportionately better cost efficiency.