


Chapter 5 - Section 5.3SHG-BLP Activity since Inception
The programme has grown steadily over the past 35 years. The growth in savings-linked SHGs by 1.63% during FY 2025-26, alongside a 11.53% increase in savings, indicates continuing deepening of financial intermediation within the SHG ecosystem. However, region-wise growth has not been uniform.


SHG-Bank Linkage Programme: Moving from Financial Inclusion to overall wellbeing
5.3 SHG-BLP Activity since Inception
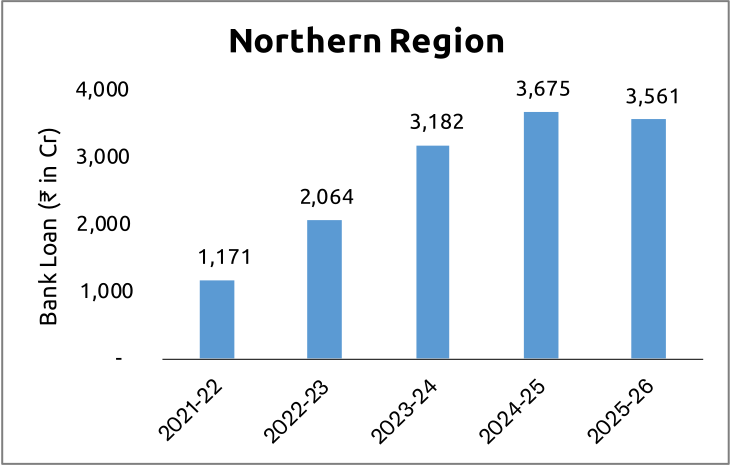
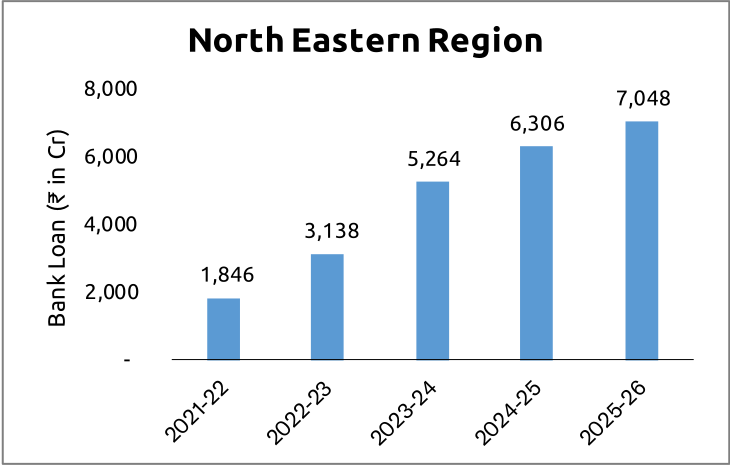
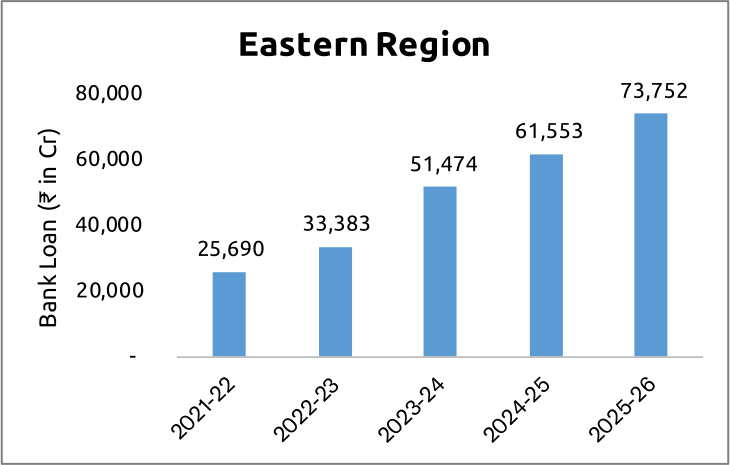
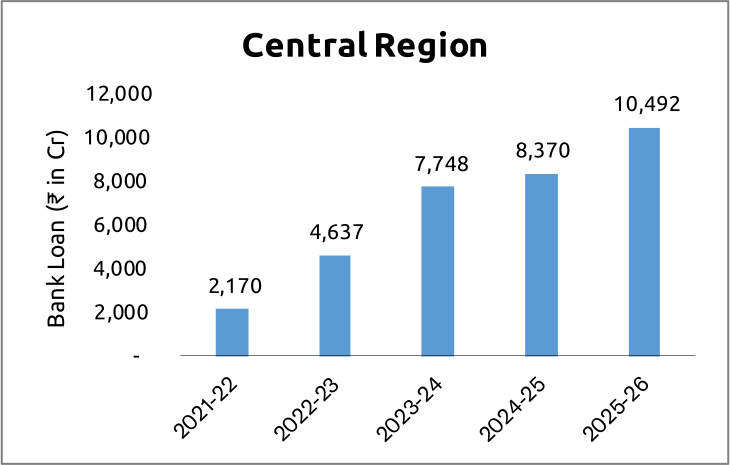
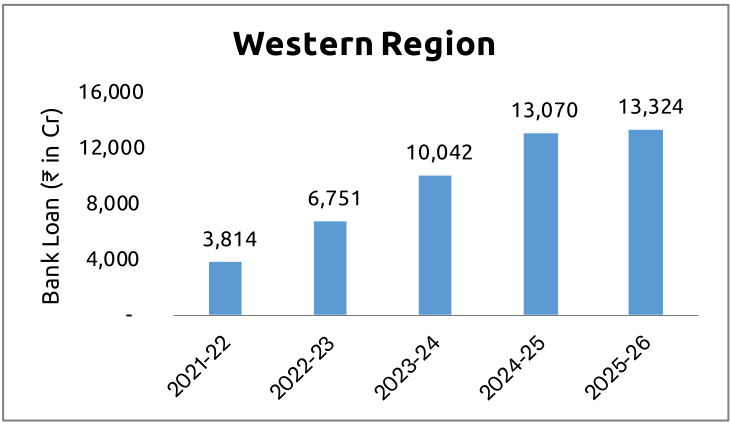
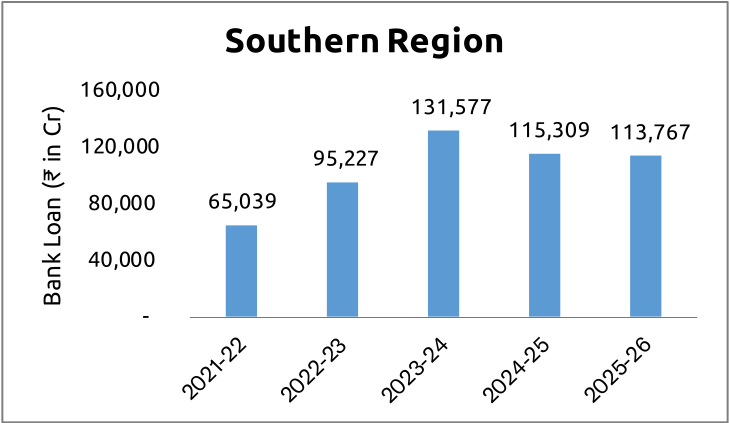
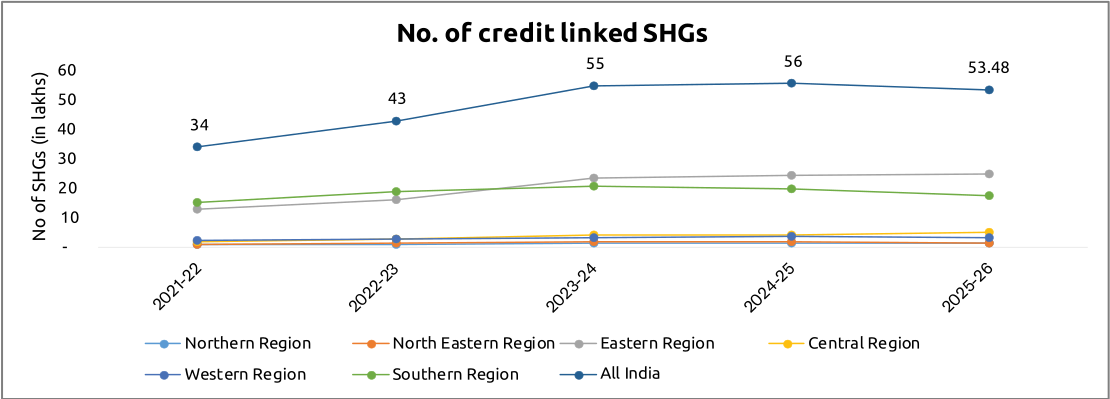
The programme has grown steadily over the past 35 years. Both the number of credit-linked SHGs and the bank loan disbursed have grown significantly since the year 2000. The growth in savings-linked SHGs by 1.63% during FY 2025-26, alongside a 11.53% increase in savings, indicates continuing deepening of financial intermediation within the SHG ecosystem. Across the regions the outreach and credit disbursement have increased manifold, showcasing the enduring strength of SHG-BLP. However, region-wise growth has not been uniform, indicating the varying maturity levels of the SHGs formed, which form the bedrock for the success of the SHG-BLP. The region-wise trend in the spread of credit linkage of SHGs is shown in Figure 5.1.
Figure 5.1: Historical Trend in Credit Linkage and Bank Loan Disbursed
5.3.1 Saving performance of SHG-BLP
Regular thrift remains the foundation of the SHG-Bank Linkage Programme, reflecting the principle of “first saving, then credit.” Members make periodic contributions - weekly, fortnightly, or monthly - to build a common group fund. This fund is initially used for internal lending, enabling members to meet small and immediate credit needs while developing financial discipline and repayment behaviour. Surplus funds are maintained in a savings account opened in the name of the SHG with a bank, providing the group with a secure formal savings mechanism and establishing its relationship with the banking system. The RBI enabled SHGs to open bank account and do the transactions, although they are informal group, in its historical decision of 1992. Thus, the keep their surplus savings and also avail of credit through these accounts.
As of 31 March 2026, total savings under SHG-BLP grew by 11.53% year-on-year, reaching ₹79,669 crore, reflecting strong financial discipline and effective corpus mobilisation among SHGs. The number of savings-linked SHGs rose by 1.63% to 145.63 lakh. An important compositional change was the continued shift towards exclusive women SHGs. Savings-linked women SHGs rose to 131.06 lakh, constituting 90.35% of all savings-linked groups.
Figure 5.2: Region-wise Progress of Saving Linkage of SHGs with Banks during FY 2025-26
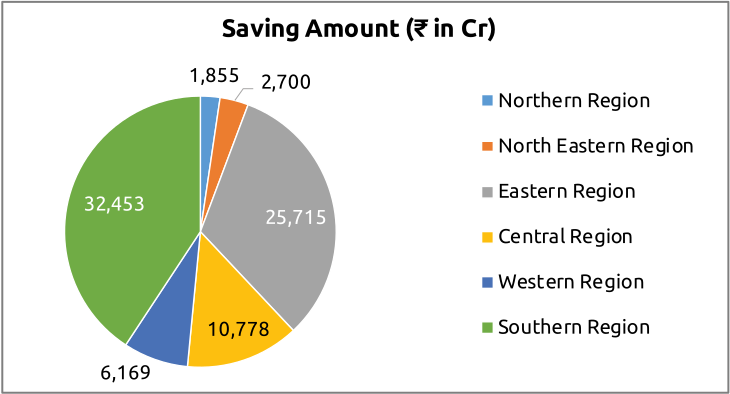
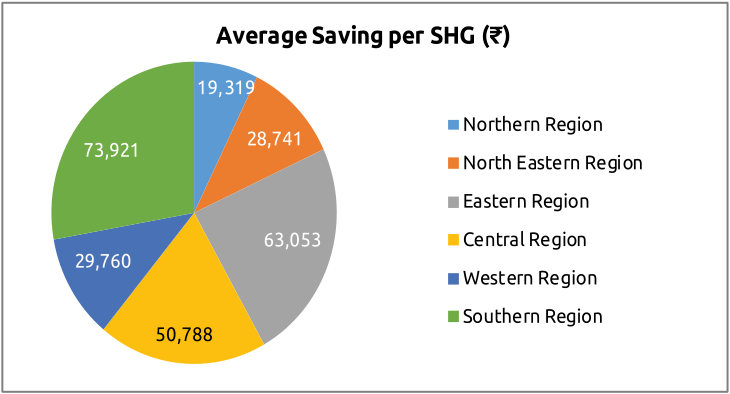
Regionally, the Southern and Eastern zones led the savings figures with ₹32,453 crore and ₹25,715 crore, respectively. In terms of the number of savings-linked SHGs, growth was recorded in all regions except the Western region. The Southern region reported the highest average savings per SHG at ₹73,921, followed by the Eastern region at ₹63,053, while the Northern region recorded the lowest at ₹19,319.
Figure 5.3: Agency-wise Savings of SHGs with Banks as on 31 March 2026
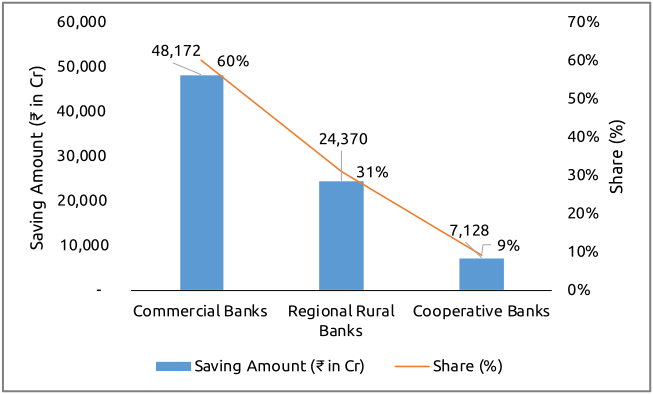
Commercial Banks, with their extensive network and outreach, financial strength, technological advancements, risk management practices and professional expertise, continued to hold the maximum share of SHG savings, accounting for 60% of total savings mobilised of ₹48,172 crore followed by RRBs at ₹24,370 crore (31%) and Cooperative Banks at ₹7,128 crore (9%). RRBs continued to have a relatively stronger presence in the North Eastern and Central regions. The programme has also shown a gradual shift towards women-centred and NRLM-supported SHG institutions. Savings-linked SHGs promoted under DAY-NRLM2 constituted 105.55 lakh groups as of 31 March 2026. In terms of savings value, NRLM groups accounted for ₹61,365 crore. Similarly, the number of saving linked SHGs promoted under DAY-NULM3 constituted 6.1 lakh as on 31 March 2026 and the corresponding savings amounted to ₹ 4,457 crore.
2 https://www.pib.gov.in/PressReleasePage.aspx?PRID=2181702®=3&lang=2
3 https://www.pib.gov.in/PressReleaseIframePage.aspx?PRID=2037057®=48&lang=2
5.3.2 Credit disbursement to SHGs
Over the past decade, credit disbursement through the SHG Bank Linkage Programme has grown substantially, with 53.48 lakh SHGs accessing fresh loans totalling ₹2,21,944 crore in FY 2025-26. While the number of SHGs availing loans declined by 3.76% over the previous year, the value of loans disbursed increased by 6.56%. This resulted in an increase in the average loan disbursed per SHG between FY 2024-25 and FY 2025-26. The trend indicates deeper credit engagement with existing and relatively mature SHGs, including repeat financing and larger loans for livelihood and income-generating activities, rather than expansion driven primarily by new credit-linked groups.
Figure 5.4: Region-wise Loan Amount Disbursed to SHGs during FY 2025-26
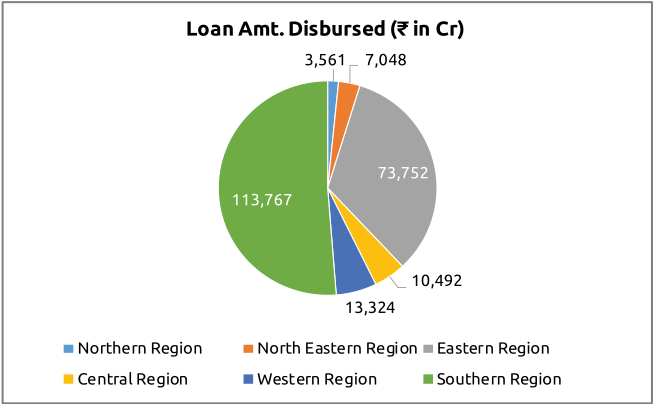
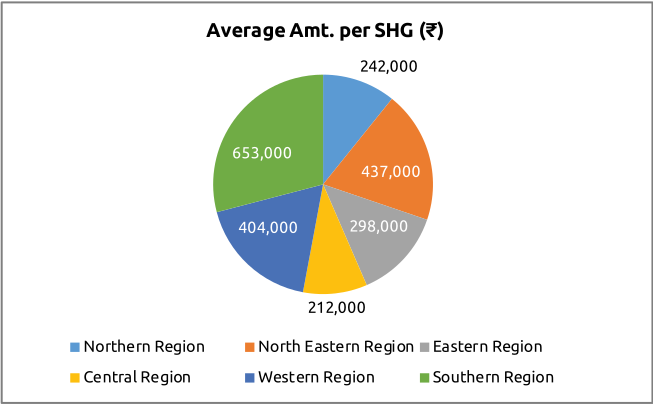
The Southern states continued to have higher average loan disbursements, reflecting a relatively mature SHG credit ecosystem, stronger repeat financing and higher credit absorption capacity in these states. The states in the Northern and Central regions continued to record relatively lower average loan disbursements, indicating scope for strengthening credit planning, livelihood-based lending and repeat credit linkage.
Figure 5.5: Agency-wise Credit Disbursement to SHGs during FY 2025-26
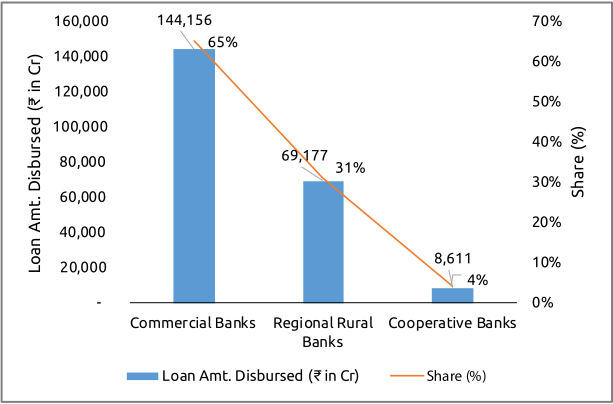
Commercial Banks accounted for the larger share of loans disbursed during the year at ₹1,44,156 crore (65%), followed by RRBs at ₹69,177 crore (31%) and Cooperative Banks at ₹8,611 crore (4%). Under DAY-NRLM, credit was extended to 43.62 lakh SHGs during the year FY 2025-26, up 1.44%, with total credit disbursed of ₹1,81,983 crore. Under DAY-NULM, Credit was extended to 1.82 lakh SHGs, a decrease of 6.19%, with total credit disbursed of ₹11,395 crore during FY 2025-26.
5.3.3 Loans outstanding under SHG-BLP
The outstanding bank loan portfolio under SHG-BLP increased by 9.47% during FY 2025–26 to ₹3,33,077 crore, despite a marginal decline in the number of SHGs with loans outstanding from 84.94 lakh to 83.24 lakh. The average loan outstanding per SHG increased to ₹4.00 lakh, compared with ₹3.58 lakh in the preceding year. This indicates the growing support from the banking system for the SHG Bank linkage programme.
Figure 5.6: Region-wise Loan Outstanding with SHGs as on 31 March 2026
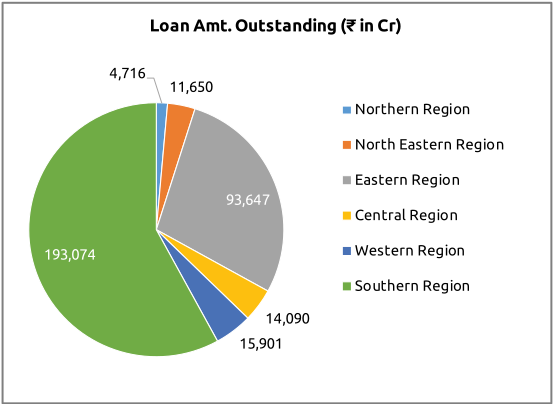
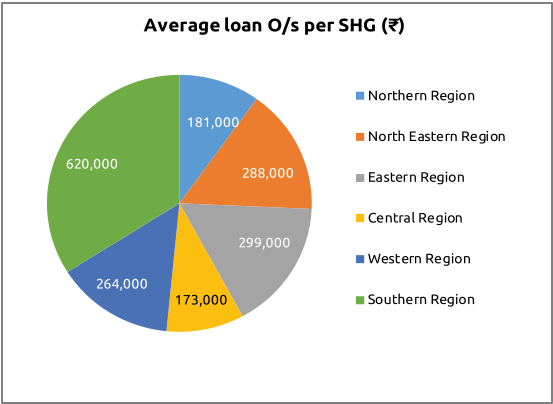
Figure 5.7: Agency-wise Loan Outstanding against SHGs as on 31 March 2026
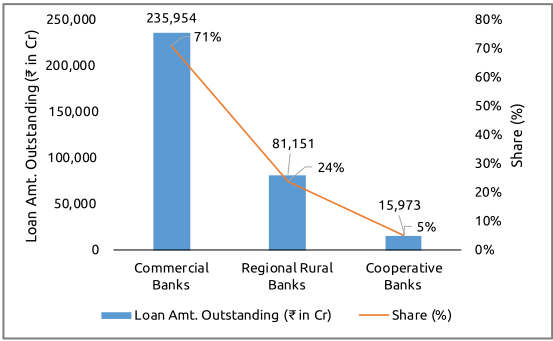
The Southern region maintained the pole position in total outstanding loans at ₹1,93,074 crore, followed by the Eastern region at ₹93,647 crore. The larger share of credit linkage to SHGs is by Commercial Banks, followed by Regional Rural Banks, while Cooperative Banks contribute a comparatively smaller share. As on 31 March 2026, Commercial Banks accounted for 71% of outstanding loans to SHGs. Despite their smaller operational scale, RRBs held a notable 24% share by amount, reflecting their growing role in rural finance, with a substantial presence in the Central, North Eastern and Eastern regions. Cooperative Banks, although limited in reach, contributed approximately 5% of the overall credit linkage. Under DAY-NRLM, the number of SHGs with credit outstanding increased by 2.53% to 66.90 lakh as on 31 March 2026, with the outstanding loan amount rising by 11.17% to ₹2,68,722 crore. Under DAY-NULM, the number of SHGs with outstanding credit declined by 6.88% to 3.79 lakh, while total outstanding credit rose by 11.79% to ₹18,273 crore.
5.3.4 Non-Performing Assets (NPAs) in SHG-BLP
The SHG Bank linkage programme has historically shown the best repayment performance among comparable credit portfolios. After several years of steady improvement, FY 2025-26 saw a mild reversal: the overall level of NPAs on bank loans extended to SHGs rose to 2.00% as on 31 March 2026, from 1.74% as on 31 March 2025. The overall stress faced by the microfinance sector must have also had its effect in the increase of NPAs in SHG-BLP, as there are several members who have loans from both the systems.
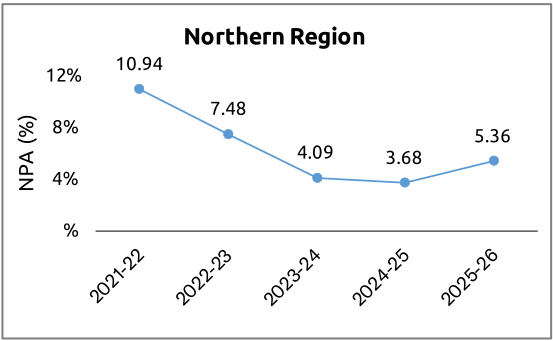
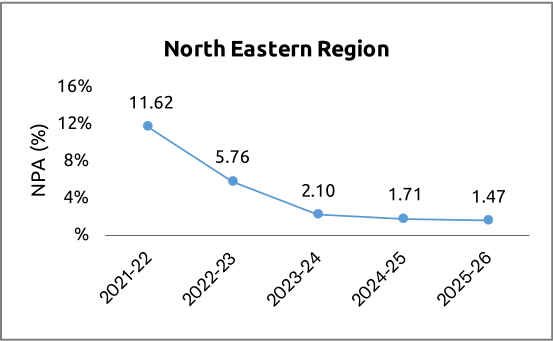
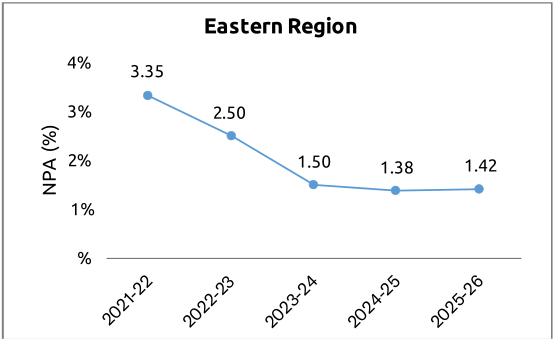
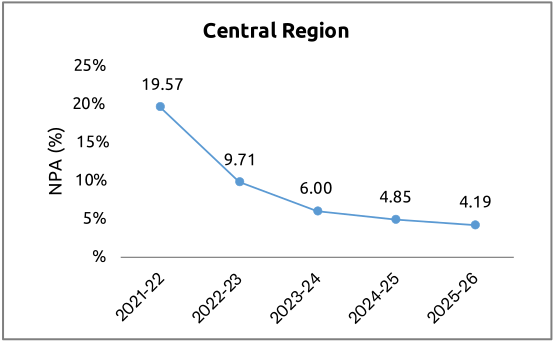
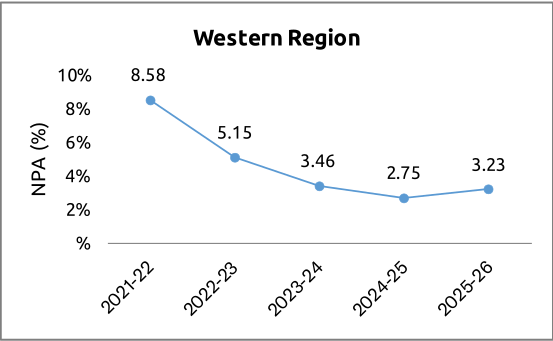
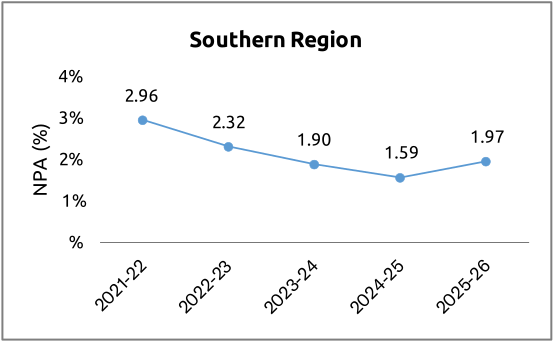
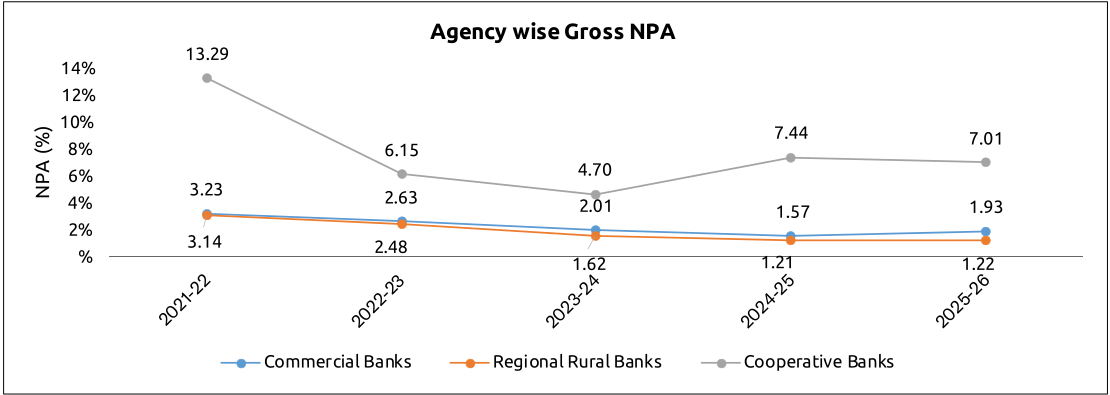
Region-wise, the trend was mixed. The NPA percentage declined in the North Eastern region (from 1.71% to 1.47%) and the Central region (from 4.85% to 4.19%), but increased in the Northern (3.68% to 5.36%), Eastern (1.38% to 1.42%), Western (2.75% to 3.23%) and Southern (1.59% to 1.97%) regions. The Northern region now records the highest NPA ratio in the programme, displacing the Central region. Among the lenders, Regional Rural Banks demonstrated the strongest asset quality at 1.22%, followed by Commercial Banks at 1.93%. Loans extended by Cooperative Banks continued to show significantly higher NPAs at 7.01%, although they had limited exposure to SHG lending. Cooperative Banks clearly need to strengthen asset quality, monitoring and portfolio management, alongside targeted capacity building and recovery support.
Figure 5.8: Trend in Region-wise and Agency-wise Gross NPAs in SHG-BLP
Despite the continued expansion in the value of savings, credit disbursement and loan outstanding, a substantial credit-linkage gap persists. As of 31 March 2026, only 83.25 lakh of the 145.63 lakh savings-linked SHGs had loans outstanding with banks, implying a credit gap of 42.84%. This indicates significant scope for improving the conversion of savings-linked SHGs into credit-linked groups, particularly through timely first-cycle and repeat credit, better bank-SHG engagement and stronger livelihood-based credit planning. The programme also continues to show regional variation. The Southern and Eastern regions remained the largest contributors to the SHG-BLP, together accounting for a substantial share of savings-linked SHGs, savings balances, loan disbursements and loan outstanding. The variation in average savings, credit linkage, loan size and credit gap across regions points to the need for differentiated strategies based on SHG maturity, institutional capacity, livelihood opportunities and bank presence.
Going forward, the focus of SHG-BLP needs to move beyond the expansion of savings accounts and group loans towards improving the quality of financial access. This includes reducing the credit-linkage gap, strengthening repeat credit, expanding enterprise finance for mature SHGs and individual members, improving digital financial capability, and facilitating access to insurance, pensions, health protection and other social-protection schemes. The next phase of SHG-BLP should therefore be assessed not only by the number of groups linked with banks, but also by its contribution to women-led enterprise, household resilience, sustainable livelihoods and economic empowerment