


Chapter 4 - Section 4.4Self-Sustainability and Profitability
Although the sector went through a recalibration phase, it has recorded a positive Return on Assets (RoA) with a weighted average of 0.21%, as against (-1.71%) in FY2024-25, and the Return on Equity (RoE) improved to 2.51% from a near-flat 0.32% in the previous year. This clearly indicates that the worst is over and the microfinance sector is on the comeback.


Chapter 4: Section IV
Self-Sustainability and Profitability
Although the sector went through a recalibration phase, it has recorded a positive Return on Assets (RoA) with a weighted average of 0.21%, as against (-1.71%) in FY2024-25, and the Return on Equity (RoE) improved to 2.51% from a near-flat 0.32% in the previous year. This clearly indicates that the worst is over and the microfinance sector is on the comeback.
Other parameters, such as Operational Self-Sufficiency (OSS), held steady at 104% industry-wide, unchanged from last year; the Private Limited Companies segment recovered from 95% to 101.5% this year. The improvement aligns with the asset-quality gains detailed in Section 4.2 and, at least in part, with the finance-cost reduction documented in Section 4.3, with the RBI easing policy rates through late 2025 and early 2026. The overall economy looked better during the year, reflecting the improvement in the microfinance sector also, as the Indian economy grew at an estimated 7.4% in FY2025-261.
That recovery, however, was neither uniform nor complete. NBFC-MFIs, which carry the bulk of the sector’s portfolio, led the improvement with a positive RoA of 0.34% and RoE of 2.69%. The clearest divide was by size. Only Very Large MLIs (Portfolio>₹5,000 crore) reported positive returns, with RoA of 1.88% and RoE of 7.36%, while all other categories recorded negative RoA. The asset quality showed improvement at the top end of the sector, whereas the growing tail of smaller institutions remained under stress. The RBI’s rate cuts benefitted mostly the larger and higher-rated NBFC-MFIs, and they have reported better profitability than the remaining. Thus, the sector’s recovery story, although real, is more due to the larger institutions than the sector-wide one.
1 Ministry of Statistics and Programme Implementation (MoSPI), Press Note on First Advance Estimates of National Income, 2025-26, released 7 January 2026 (FY2025-26 real GDP growth of 7.4%). Reserve Bank of India, Monetary Policy Committee statements, December 2025 and February 2026 (repo rate held at 5.25% in February 2026 following a 25-bps cut in December 2025; FY2025-26 retail inflation projected at 2.1%). See “India Holds Rates, Revises Up FY25/26 GDP Forecasts,” Trading Economics, 6 February 2026. https://www.mospi.gov.in/uploads/latestReleases/latest_release_1767781372753_1380ce82-f5a5-440d-99e6-e6b35af0deb5_GDP_Press_Note_on_FAE_2025-26.pdf ; https://tradingeconomics.com/india/interest-rate/news/523674
4.4.1 Surplus
At the end of FY2025-26, around 16% of MLIs reported negative operating profit, while 22% reported a negative net surplus. The aggregate operating profit stood at approximately ₹5,534 crores, with an overall positive net surplus of ₹662 crores, indicating an improvement in the sector’s overall financial position over the previous year. However, negative surpluses among several smaller and mid-sized MLIs continue to highlight sustainability and capital-absorption concerns. NBFC-MFIs recorded a positive net surplus of around ₹639 crores, while Pvt. Ltd. Companies reported a negative surplus of approximately ₹41 crores. Overall, the FY2025-26 data indicate a recovery in aggregate profitability, although financial pressures remain concentrated among certain institutions and size bands, echoing the same bifurcation seen in asset quality and returns.
4.4.2 Operational Self-Sufficiency (OSS2)
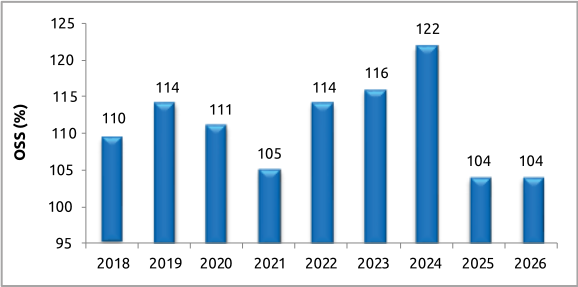
Operating efficiency remains an important consideration for MLIs as the institutions balance the need to maintain outreach and service delivery with the requirement to manage costs sustainably. In FY2025-26, the Operational Self-Sufficiency (OSS) ratio stood at 104%, indicating that operating income was sufficient to cover operating expenses, with a modest surplus of income over expenses. The past trend recorded a gradual strengthening of operating efficiency over the period of time, with the OSS ratio moving from 110% in 2018 to a peak of 122% in 2024, before moderating to 104% in both 2025 and 2026. As the business improves, we may see a better OSS ratio in the future. But the ratio remaining above 100% indicates that MLIs continued to maintain operational self-sufficiency. The moderation suggests that the sector’s operating income has remained adequate to meet its operating cost base, even as cost pressures have persisted. Going forward, maintaining this positive margin will depend on institutions’ ability to improve productivity, manage operating costs and sustain adequate income generation, particularly in an environment where growth is moderating and the underlying cost base remains relatively elevated.
2 OSS = (Total Income/Total Expenses) x100
Figure 4.4.1: Average OSS of MLIs over the years and its break-up between various categories
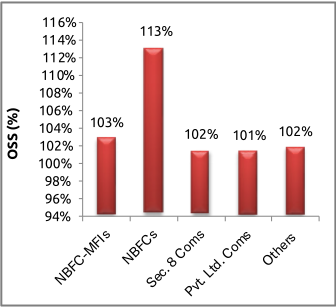
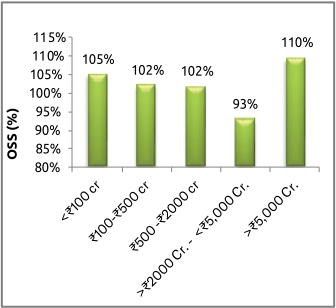
Across legal forms, the ratio was highest among NBFCs at 113%, followed by NBFC-MFIs at 103%, Section 8 Companies and Others at 102%, and Pvt. Ltd. Companies at 101%. By institution size, the ratio was highest among MLIs with AUM above ₹5,000 crore at 110%, while institutions with AUM between ₹2,000–₹5,000 crore recorded the lowest ratio at 93%. Variation across institution types and sizes suggests that operating efficiency depends not only on scale but also on institutions’ underlying cost structures and business models. The lower ratio among the ₹2,000–₹5,000 crore segment points to comparatively stronger cost absorption. Overall, the data highlights the need for continued cost optimisation and productivity improvements, particularly among institutions where operating expenses remain higher than operating income.
Analysing OSS against average loan outstanding per borrower is important for understanding how changes in loan size relate to the operating efficiency of MLIs. As loan sizes increase, institutions may benefit from economies of scale, which result in higher income per borrower. Examining this relationship therefore helps assess whether larger average loan sizes are translating into greater operating efficiency and better absorption of operating costs, and provides insight into the sustainability of different lending models.
Figure 4.4.2: OSS based on average loan outstanding per borrower
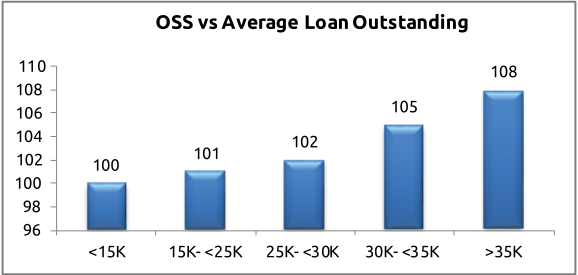
In FY2025-26, the Operating Self-Sufficiency (OSS) ratio showed a clear relationship with average loan outstanding, increasing progressively as average loan outstanding rose. MLIs with an average loan outstanding of less than ₹15,000 recorded an OSS ratio of 100%, while the ratio increased to 101% for ₹15,000–₹25,000, 102% for ₹25,000–₹30,000, 105% for ₹30,000–₹35,000 and 108% for loans above ₹35,000. Since OSS measures how much operating income covers operating expenditure, the rising ratio indicates that institutions with larger average loan sizes generated relatively higher operating income relative to their operating expenses. This may reflect greater income generation per borrower or loan account, improved revenue absorption of operating costs, and differences in portfolio composition and operating models. The trend suggests that higher average loan sizes were associated with stronger operating self-sufficiency, although the relationship may also reflect differences in pricing, portfolio quality, productivity, and institutional scale.
Analysing OSS against portfolio yield helps assess how effectively operating income from the portfolio translates into coverage of operating expenditure. Because OSS reflects an institution’s ability to meet operating expenses through operating income, a higher ratio indicates stronger operating self-sufficiency. Examining this relationship therefore helps determine whether higher portfolio yields are associated with greater income coverage of operating costs and whether institutions at different yield levels can maintain sufficient operating income to support ongoing operations.
Figure 4.4.3: OSS based on yield category
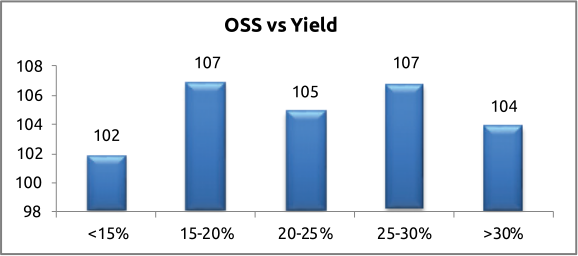
In FY2025-26, the OSS ratio remained above 100% across all yield categories. It was 102% for MLIs with yield below 15%, increased to 107% for the 15–20% yield category, and moderated slightly to 105% for 20–25%. The ratio then rose to 107% for 25–30% yield before falling to 104% among MLIs with yields above 30%. The pattern does not show a linear relationship between yield and operating efficiency, suggesting that higher portfolio yield by itself does not necessarily translate into proportionately better cost efficiency.
4.4.3 Profitability Ratios
Analysing Return on Assets (RoA) and Return on Equity (RoE) is important for assessing how effectively MLIs are using their capital to build better quality assets and wealth for investors. Together, these measures provide a broader view of profitability and financial sustainability, particularly when considered across portfolio size-wise.
Figure 4.4.4: Return on Assets (ROA) and Return on Equity (ROE) of MLI: Size-wise
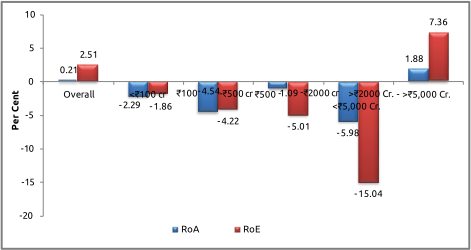
The relationship between institution size and RoA/RoE provides an important perspective on how scale is translating into profitability and returns on the capital employed. When viewed alongside the surplus position of MLIs, the distribution shows a clear differentiation between larger and smaller institutions.
The return profile closely reflects the surplus position across size categories. MLIs with AUM below ₹2,000 crore recorded negative RoA and RoE, indicating that the negative surplus reported among these segments translated into weaker returns on both assets and equity. The ₹2,000–₹5,000 crore category recorded the weakest performance, with RoA of -5.98% and RoE of -15.04%, pointing to significant profitability and capital-efficiency pressures. In contrast, Larger MLIs with AUM above ₹5,000 crore recorded positive RoA of 1.88% and RoE of 7.36%, consistent with their substantially stronger surplus position. The pattern suggests that scale is an important factor in the sector’s ability to absorb operating and financial costs and generate sustainable returns, with profitability increasingly concentrated among the largest institutions — the same institutions that, per Section 4.3, have captured the bulk of the benefit from the RBI’s recent rate cuts.
Box 4.4.1: Digital Collections through UPI: Modernizing Rural Loan Repayments
SATYA’s UPI-enabled collections are transforming the repayment experience for rural borrowers by making repayments more convenient, secure, and efficient. Through client-specific UPI QR codes, borrowers can make repayments directly from their mobile phones, reducing the need for cash handling, travel, and dependence on field officers. The introduction of UPI Autopay has further strengthened the initiative by enabling recurring repayments and promoting timely payments and financial discipline.
The initiative recorded more than ₹1,500 crore in cashless collections during FY 2025–26 across 26 States and Union Territories, reflecting the growing acceptance of digital payments in rural and semi-urban areas. Cashless collections have reduced risks related to theft, fraud, errors, and cash logistics, while enabling field staff to focus more on client engagement and financial literacy.
For rural women entrepreneurs, digital repayments have also emerged as an important tool for financial inclusion and empowerment. By using UPI, QR codes, mobile banking applications, and digital wallets, borrowers are gaining confidence in participating in the formal digital financial ecosystem. The initiative also supports sustainability by reducing paper usage and the environmental footprint associated with cash-based transactions.
With a vision to expand adoption to 10 million households by 2030, SATYA’s UPI-enabled collections demonstrate how technology, customer-centricity, and financial inclusion can come together to make rural finance more accessible, sustainable, and empowering.
Key Impact:
- Greater convenience & security through UPI-based, cashless repayments.
- Timely repayments enabled by UPI Autopay, supporting financial discipline.
- Improved field efficiency and greater focus on client engagement.
- Enhanced digital and financial inclusion, especially among rural women.
- Reduced paper use and cash-handling risks, supporting sustainability.
- Target: Reach 10 million households by 2030.
Courtesy: Satya MicroCapital Ltd.
Conclusion
The microfinance institutions can survive only if they have profitable operations. They should be able to have Operational Self-Sufficiency and also generate adequate income to have a positive ROA and ROE. This can only attract more investment in the sector, which will benefit the poorer households directly. The sector’s financial performance in FY2025-26 reflects a mixed but gradually improving picture, on the whole. But granular analysis indicates that this positiveness is due to the performance of larger institutions rather than a sector-wide phenomenon. It is very clear that the sector is in a growth phase which has to be supported by funds. If funds are made available, even smaller ones can perform positively and record better profitability ratios.
The analysis has shown that the larger MLIs demonstrated stronger capacity to absorb costs and generate returns, while several smaller and mid-sized institutions continued to face pressure on profitability, RoA and RoE. The analysis also indicates that higher loan size translates into better operating efficiency. Whereas such a correlation is not there with yield. Going forward, cost optimisation, productivity improvement, prudent growth and stronger financial management will remain important for strengthening the sustainability and resilience of MLIs, particularly if the current, unevenly distributed tailwind from lower funding costs does not persist or does not reach smaller institutions in time.