


Chapter 4 - Section 4.3 - SubSection 4.3.2Income Analysis
The income structure of microfinance institutions provides an important indication of the strength and sustainability of their core business model, as well as the extent to which institutions are developing complementary revenue sources. While interest income from lending remains central to the sector, institutions are increasingly engaging in activities such as portfolio securitisation, fee-based services, business correspondent arrangements and third-party product distribution. Examining the composition of income helps assess the sector’s dependence on lending income, the degree of revenue diversification, and its potential resilience to changes in portfolio growth, interest rates, and funding costs — resilience that matters more in a year when the RBI’s own monetary cycle has been moving, since a portfolio dominated by interest income is, by construction, more exposed to swings in the wider rate environment than one with a meaningful share of fee-based or non-lending revenue.


Figure 4.3.5: Break-up of Income
4.3.2 Income Analysis
The income structure of microfinance institutions provides an important indication of the strength and sustainability of their core business model, as well as the extent to which institutions are developing complementary revenue sources. While interest income from lending remains central to the sector, institutions are increasingly engaging in activities such as portfolio securitisation, fee-based services, business correspondent arrangements and third-party product distribution. Examining the composition of income helps assess the sector’s dependence on lending income, the degree of revenue diversification, and its potential resilience to changes in portfolio growth, interest rates, and funding costs — resilience that matters more in a year when the RBI’s own monetary cycle has been moving, since a portfolio dominated by interest income is, by construction, more exposed to swings in the wider rate environment than one with a meaningful share of fee-based or non-lending revenue.
The income structure of microfinance institutions remains strongly concentrated in interest income from the loan portfolio, which accounts for 80% of total income. This highlights the sector’s continued dependence on core lending as its primary revenue source. Portfolio sale and securitisation contribute 5%, while investment income accounts for 2%. Other revenue streams, including processing fees (3%), other fees and charges (2%), BC agreements (3%), third-party product sales (0.3%) and other sources (5%), together account for a relatively modest share.
Figure 4.3.5: Break-up of Income
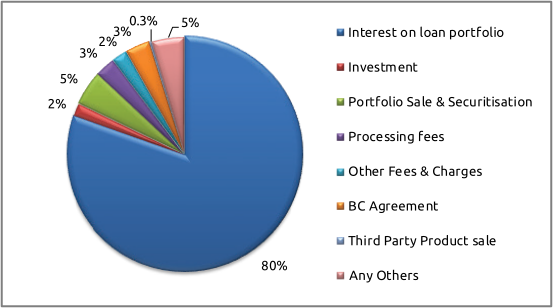
The composition indicates that while institutions are developing supplementary revenue streams, lending remains the dominant business model. Diversification through securitisation, fee-based services, BC arrangements, and third-party products can provide additional income and support liquidity and capital management. However, heavy reliance on interest income also means portfolio growth, repayment performance, pricing, and cost of funds remain critical determinants of institutional financial performance. In the current environment of moderated portfolio growth and heightened focus on responsible lending, developing sustainable non-interest revenue streams could become increasingly relevant for improving income resilience without relying solely on loan portfolio expansion.
4.3.2.i Yield on Loan Portfolio
Portfolio yield is an important indicator of the revenue-generating capacity of the microfinance portfolio and provides insight into the relationship between lending operations, pricing and institutional sustainability. It reflects the income generated from the loan portfolio and is influenced by factors such as interest rates, portfolio composition, borrower repayment patterns and changes in lending practices. Tracking portfolio yield over time helps assess how the sector has responded to changing market conditions, regulatory developments and the growing emphasis on responsible lending.
Figure 4.3.6: Yield Trend of MLIs
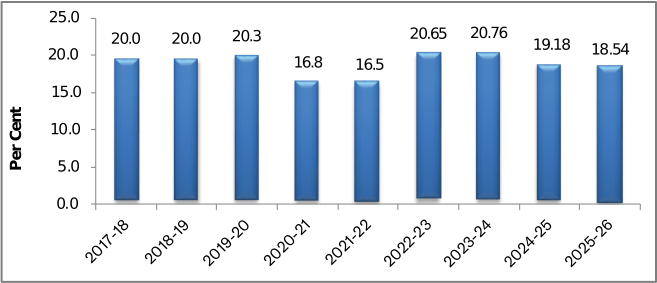
The trend indicates that the yield/return from the microfinance portfolio remained relatively stable at around 20% during 2017–20, before declining sharply during the pandemic period to 16.8% in 2020–21 and 16.5% in 2021–22. It recovered strongly thereafter, reaching 20.65% in 2022–23 and 20.76% in 2023–24. Since then, the ratio has moderated to 19.18% in 2024–25 and 18.54% in 2025–26. The recent decline of 64 basis points in 2025–26 suggests some moderation in portfolio yield, potentially reflecting changes in portfolio mix, pricing, competitive conditions and the increasing emphasis on responsible lending under the RBI’s principles-based pricing framework for microfinance loans, which requires institutions to set rates through a board-approved policy rather than a prescribed cap. Alongside rising operating costs and relatively stable finance costs, the lower yield could put pressure on institutional margins. However, the current level remains above the pandemic-period lows, indicating that the sector continues to generate a relatively stable return from its core lending portfolio.
Figure 4.3.7: Yield on Portfolio across MLIs
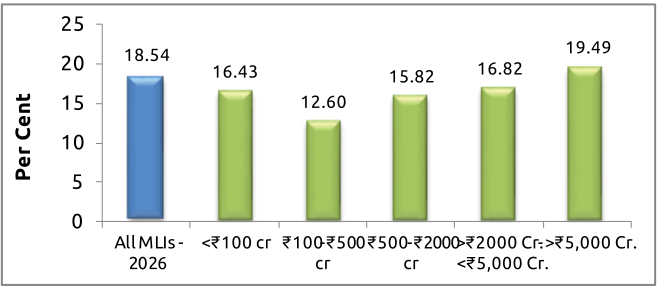
The 2026 portfolio yield shows a clear relationship with institutional scale, with larger institutions generally reporting higher yields. The overall yield stands at 18.54%, while institutions below ₹100 crore record 16.43% and those in the ₹100–500 crore category recorded the lowest yield of 12.60%. Yields then rise to 15.82% for ₹500–2,000 crore, 16.82% for ₹2,000–5,000 crore, and reach 19.49% for institutions above ₹5,000 crore. This variation may reflect differences in portfolio composition, pricing, product mix, and larger institutions’ ability to optimise portfolio deployment.