


Chapter 1Indian Microfinance: Resilience, Responsibility & Inclusion
The health of Indian microfinance is not determined within Indian microfinance. It is determined in the space between the national economy and the household kitchen — in the distance a macroeconomic impulse must travel before it becomes, or fails to become, a repayment. This chapter maps that distance for the period from FY2022-23 to FY2025-26, four years in which the sector completed an entire cycle of expansion, correction and recovery while the country around it assembled the most favourable configuration of macroeconomic conditions for low-income households in more than a decade.


Indian Microfinance: Resilience, Responsibility & Inclusion Ramesh Srivatsava Arunachalam
Introduction
The health of Indian microfinance is not determined within Indian microfinance. It is determined in the space between the national economy and the household kitchen — in the distance a macroeconomic impulse must travel before it becomes, or fails to become, a repayment. This chapter maps that distance for the period from FY2022-23 to FY2025-26, four years in which the sector completed an entire cycle of expansion, correction and recovery while the country around it assembled the most favourable configuration of macroeconomic conditions for low-income households in more than a decade. The two events are ordinarily narrated apart, one as a story of underwriting discipline and the other as a story of growth and disinflation. The argument advanced here is that they are a single story, and that neither is intelligible without the other.
Two instruments carry that argument and are used throughout. The first is a transmission framework: macroeconomic conditions reach a borrower household through nine identifiable channels — growth and income, inflation and expenditure, monetary and financial, rural and agricultural, fiscal and social protection, financial inclusion, digital, climate and shock, and institutional and regulatory — each carrying its own lag, its own leakage and its own points of blockage, and each capable of compounding, offsetting or gating the others rather than acting alone. The second is the household macro balance sheet, which holds that the surplus available for debt service is what remains of total household income after essential expenditure, debt servicing and shock costs, so that portfolio quality is a derivative of household cash-flow resilience and of nothing else. What follows applies to both records. Sections 1.1 and 1.2 set out the macroeconomic and external backdrop; Section 1.3 examines the policy response that kept the funding channel open; Sections 1.4 and 1.5 take the two terms of the identity that moved furthest, prices and income, and read them from the household’s side; Section 1.6 asks what actually made the difference, and in which direction; and Section 1.7 states what the sector should now undertake to measure.
1.1 India’s Macroeconomic Backdrop, FY2022-23 to FY2025-26
This chapter asks of each significant indicator the only question that justifies its presence in a microfinance publication: why does this matter to a low-income household? One methodological point precedes the numbers. In February 2026, the national accounts were rebased from 2011-12 to 2022-23, with improved capture of informal-sector activity, so multi-year narratives constructed across the revision require care, and several of the activities better captured under the new base are precisely those microfinance borrowers operate. Real Gross Domestic Product (GDP) grew 7.7 per cent in FY2025-26 on the provisional estimates released in June 2026, against 7.1 per cent in FY2024-25 on the same basis, with real GDP at ₹323.12 trillion.1 For the microfinance analyst, composition matters more than the headline, and the composition was favourable: the trade, repair, hotels, transport, communication and storage block, in which a very large share of microfinance-financed enterprise sits, grew at approximately 11 per cent. Manufacturing grew 10.7 per cent; agriculture grew 3.0 per cent on a record production base; private final consumption expenditure grew 7.7 per cent against 5.8 per cent the previous year; and gross fixed capital formation grew 8.2 per cent.2 Figure 1.1 sets out the composition.
Figure 1.1: The growth that reaches the household3
(Composition of Indian growth, FY2025-26, provisional estimates, 2022-23 base)
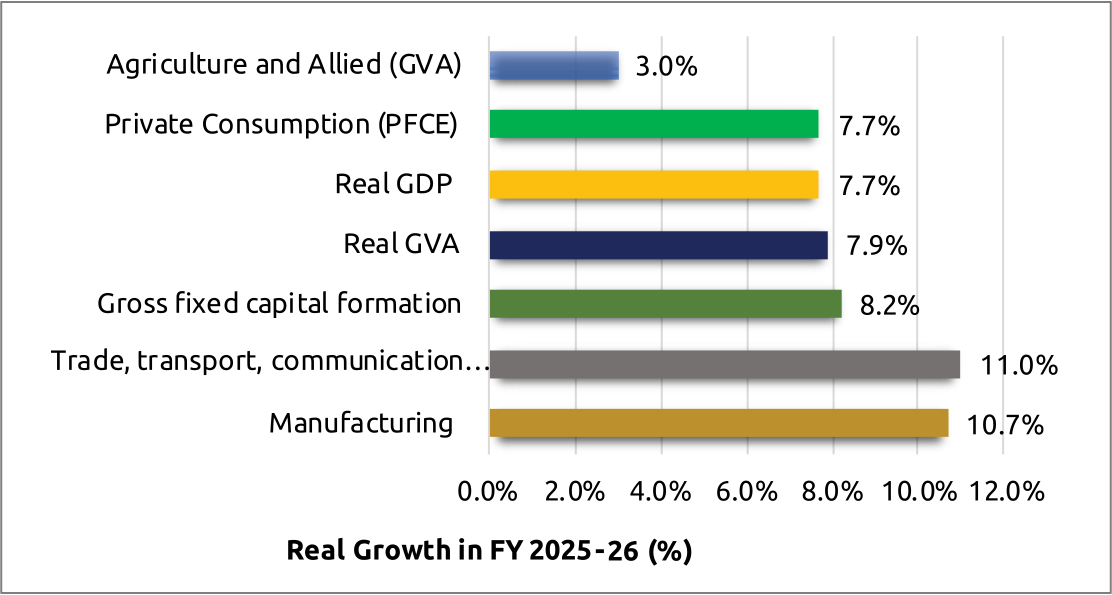
The labour-absorbing trade and transport block — where most microfinance-financed enterprises sit — led the expansion.
Two causal chains follow, and both are short. Construction and public capital expenditure generate migrant employment, which generates remittances, which raise rural household cash flows with a lag measured in weeks rather than quarters. Growth in trade, transport and hospitality raises informal enterprise turnover, and it operates in both directions at once: when that block grows, the borrower benefits twice, once as a proprietor whose own sales rise and once as supplier to and customer of neighbours whose sales also rise. Village-level enterprise income is a network property rather than an individual one. Public capital expenditure reaches the household by three routes, of which only the first is usually noted: employment during construction; asset creation, since a road that reduces the time and cost of reaching a market raises the price the producer realises, permanently; and a third that alters the lending frontier itself, since improved connectivity, electrification and water availability change what enterprises are viable in a village at all — and those new categories require larger and longer-tenor credit than the classical microfinance product provides.
Policy Rates
The policy repo rate was reduced from 6.50 per cent to 5.25 per cent in four steps between February and December 2025 and held at each of the four subsequent reviews, most recently on 5 August 2026, with a staggered 100 basis point reduction in the cash reserve ratio from September 2025 releasing roughly ₹2.5 trillion of primary liquidity.4 The easing cycle is complete for the present. Figure 1.2 sets out the path.
Figure 1.2: The easing cycle, and the pause that followed5
(Policy repo rate, January 2025 to August 2026)
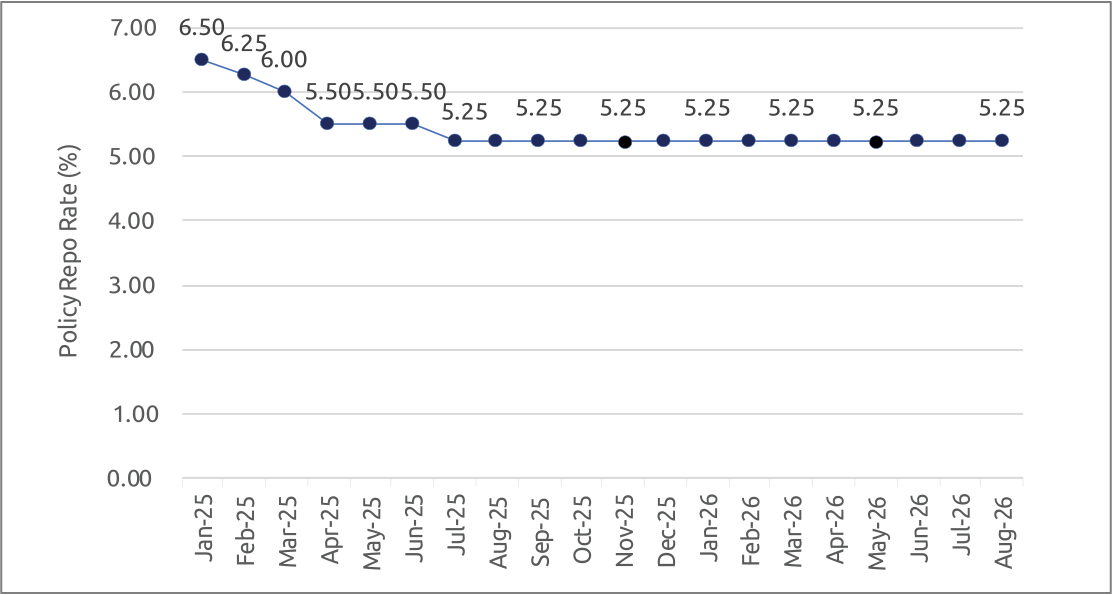
For microfinance, the binding constraint in this channel is availability of funding, not its price.
The significance of this easing runs primarily through availability rather than price. Bank lending remained the dominant funding source for non-banking financial company-microfinance institutions, at approximately two-thirds of borrowings outstanding at March 2026. An easing cycle therefore reaches the sector principally by improving the willingness and capacity of banks to lend to it, and only secondarily by reducing the rate at which they do so.
If monetary policy set the terms on which credit reached the sector, the agricultural cycle set the terms on which income reached the household. Two consecutive strong agricultural seasons defined the rural economy of the period. The 2025 south-west monsoon was above normal, reservoir storage stood above 91 per cent of live capacity in October 2025, and food grain production for 2025-26 reached a record 376.55 million tonnes against 357.73 million tonnes the previous year, an increase of approximately 5.3 per cent, with wheat at a record 120.65 million tonnes.67 The India Meteorological Department’s forecast for 2026 was below normal at 90 per cent of the long period average, the first such forecast in over a decade; cumulative rainfall stood 12 per cent below the long period average on 12 August 2026; and moderate El Niño conditions prevailed and were expected to strengthen.89 Figure 1.3 sets the two facts side by side.
Box 1.1: Data Privacy and DPDP Readiness: Strengthening Customer Trust Through Responsible Data Governance
As digital adoption accelerates in microfinance, protecting customer data has become both a business imperative and a regulatory priority. Spandana Sphoorty Financial Ltd. has launched a comprehensive Data Privacy and Digital Personal Data Protection (DPDP) Readiness Initiative to strengthen data governance, enhance customer trust, and align its operations with the Digital Personal Data Protection Act, 2023.
The initiative includes an internal assessment followed by an independent gap assessment covering data inventory and data flow mapping, consent management, data principal rights, privacy governance, third-party risk management, data retention practices, security controls, breach management, privacy notices, and organizational awareness. The findings will provide a structured roadmap for implementing DPDP core controls and strengthening the institution’s privacy framework.
A key focus of the programme is identifying and classifying personal data across business functions and technology platforms to improve visibility over data processing activities and enhance privacy controls. Existing policies and procedures are also being reviewed to incorporate privacy-by-design principles, covering consent management, data retention, third-party oversight, incident management, and customer grievance handling.
Recognizing that data privacy is an organizational responsibility, Spandana Sphoorty is also strengthening employee awareness through training programmes that promote responsible data handling and privacy compliance across all levels of the organization.
Key Outcomes
- Comprehensive assessment of data privacy practices and DPDP readiness.
- Structured roadmap for implementing DPDP core controls.
- Improved data governance through enhanced policies, privacy controls, and data lifecycle management.
- Strengthened management of third-party data processing and privacy risks.
- Increased employee awareness and accountability for responsible data handling.
- Enhanced customer trust, operational resilience, and regulatory preparedness.
Courtesy: Spandana Sphoorty Financial Ltd.
1 See Ministry of Statistics & Programme Implementation (MoSPI), Press Note on Provisional Estimates of Annual Gross Domestic Product for 2025-26. Quarterly Estimates of Gross Domestic Product for the Fourth Quarter (January-March) of 2025-26, https://www.mospi.gov.in/uploads/latestReleases/latest_release_1780655857536_5ac01869-ca4a-422d-b7a7-57b81da60932_Press_Note_on_GDP_Estimates_for_Q4_2025-26_and_PE_FY_2025-26_F.pdf.
2 An earlier figure of approximately 7.0 per cent was the January 2026 First Advance Estimate on the outgoing 2011-12 base, and referred to manufacturing and construction combined. On the 2022-23 base used throughout this section, manufacturing grew 10.7 per cent in FY2025-26 against 9.3 per cent in FY2024-25. Mixing the two series is precisely the error the rebasing caution earlier in this section warns against.
3 Source: National Statistical Office, Provisional Estimates of Annual GDP for FY 2025-26, 5 June 2026. Trade-transport-hotels figure approximate.
4 See RBI, (August, 2026), ‘Minutes of the Monetary Policy Committee Meeting, August 3 to 5, 2026’, https://www.rbi.org.in/Scripts/BS_PressReleaseDisplay.aspx?prid=63403.
5 Source: RBI, Monetary Policy Committee Statements. Stance neutral from June 2025.
6 See PIB, (May, 2026), ‘Third Advance Estimates Reflect India’s Agricultural Strength; Union Minister Shri Shivraj Singh Chouhan Approves Record Crop Projections’, https://www.pib.gov.in/PressReleaseIframePage.aspx?PRID=2265965®=48&lang=2.
7 Author’s calculation: (376.55 − 357.73) ÷ 357.73 × 100 = 5.26 per cent, shown rounded to one decimal place.
8 Position as at 12 August 2026. Cumulative departure at that date remained inside the India Meteorological Department’s “normal” classification band, but the distribution was materially uneven, with the eastern and north-eastern region carrying the largest deficit through the first half of the season. Readers should note that the season closes on 30 September and the final figure will differ.
9 See PIB, (August, 2026), ‘Parliament Question: South-West Monsoon Forecast’, https://www.pib.gov.in/PressReleasePage.aspx?PRID=2298071®=48&lang=2.
Figure 1.3: Rural India enters FY2026-27 with full buffers10
(Food grain production and monsoon performance, 2024-25 to 2026)
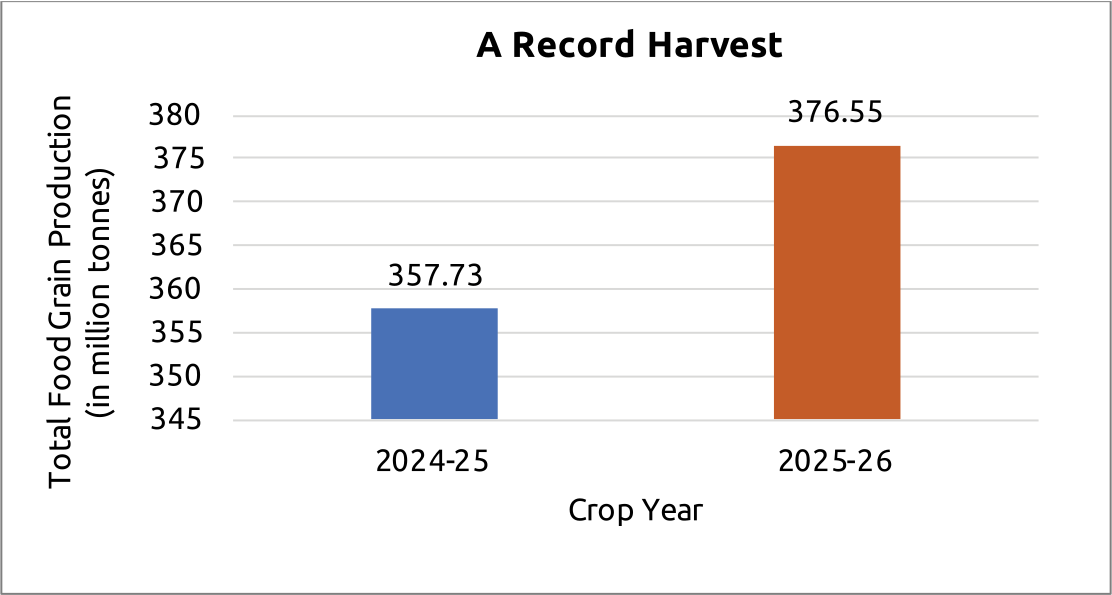
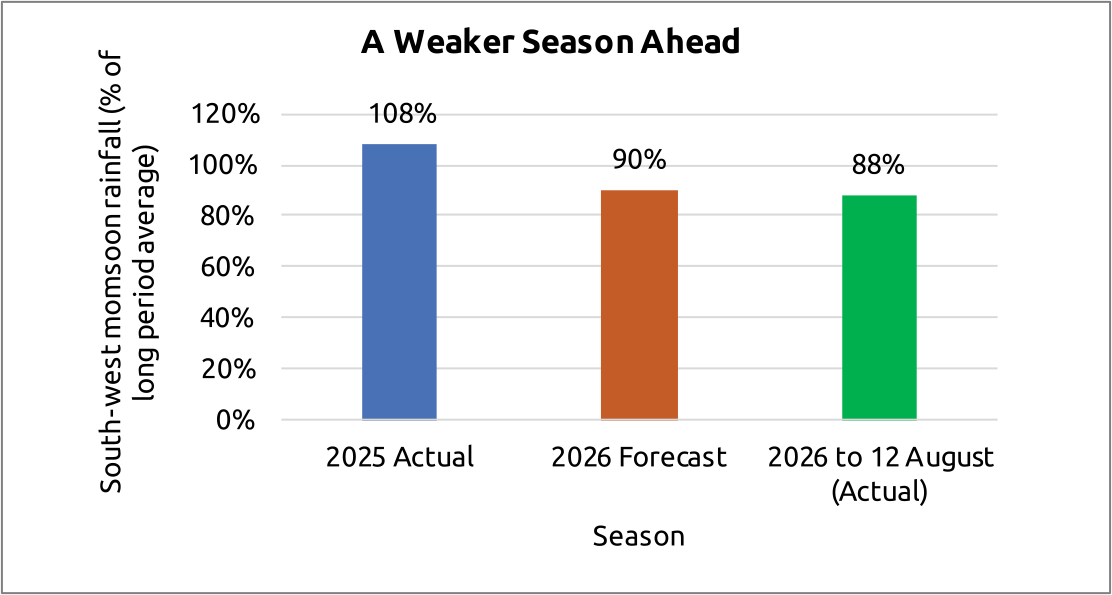
The question for the coming year is not production but whether buffers absorb a weaker season. The correct reading of this two-year sequence is that rural India entered FY2026-27 with unusually strong household balance sheets, full reservoirs and large public stocks, which is to say, with precisely the buffers that determine whether a weaker season becomes a household event or remains merely a weather event. That is the difference between a monsoon shortfall that appears in agricultural statistics and one that appears in a microfinance portfolio two quarters later. Fiscal consolidation continued alongside a sustained capital expenditure programme, with the deficit narrowing while public investment held the more favourable of the two available paths from the standpoint of low-income households, because the alternative form of consolidation operates through precisely the transfer and programme lines on which household resilience depends.
Placed against the household macro balance sheet, the backdrop of FY2025-26 supported every term of the identity at once. The appropriate conclusion is confident but precise: this was the most favourable macroeconomic environment for the Indian microfinance household in the four years under review, and probably in more than a decade. The sector’s recovery in portfolio quality is therefore not solely, and probably not even mainly, an achievement of sector-level discipline; it is the joint product of that discipline and an exceptionally supportive configuration. Stating this plainly is not a diminishment - a favourable environment does not repair a book by itself — but the necessary basis for the more useful question, which is which of the improvements achieved were structural and will persist. Table 1.1 sets out the principal macroeconomic indicators and their relevance to the household.
Table 1.1: Selected macroeconomic indicators and their relevance to the microfinance household
| Indicator | FY 2024-25 | FY 2025-26 | Why it matters to the household |
|---|---|---|---|
| Real GDP growth | 7.1% | 7.7% (provisional) | Sets the outer bound; composition determines who benefits |
| Trade, transport, hotels, communication | — | approx. 11% | The block in which the borrower enterprise itself operates |
| Manufacturing | — | 10.7% | Wage employment and migrant absorption |
| Agriculture and allied (GVA) | 4.2% | 3.0% | Moderate growth on a record production base |
| Private final consumption | 5.8% | 7.7% | Local demand for the microenterprise’s output |
| Gross fixed capital formation | — | 8.2% | Construction employment, then permanent productivity gain |
| Policy repo rate (year-end) | 6.25%11 | 5.25% | Reaches the borrower through funding availability |
| Food grain production | 357.73 million tonnes | 376.55 million tonnes | Farm income, food prices and buffer stock adequacy |
| Headline retail inflation | Moderating through the year | Below tolerance band for much of the year | The single fastest determinant of household surplus |
Note: FY2025-26 figures are provisional or first-estimate positions. National accounts rebased to 2022-23 with effect from February 2026; figures are not directly comparable with earlier published series on the 2011-12 base. Sectoral growth figures are shown to one decimal place where officially published and as approximations otherwise.
10 Sources: Ministry of Agriculture and Farmers’ Welfare crop estimates; India Meteorological Department long-range forecasts. 2025 figure applies to the full season; 2026 figures are the forecast and the season position to 12 August.
11 The repo rate stood at 6.25 per cent on 31 March 2025. The reduction from 6.50 to 6.25 per cent took effect at the February 2025 review; the move to 6.00 per cent followed at the April 2025 review, which falls in FY2025-26, not FY2024-25.
1.2 The External Environment, Climate and the Rural Household
The macroeconomic backdrop was favourable. It was not calm. The geopolitical issues also added to the misery. Three external developments defined the period. The first was the reordering of global trade, with the United States announcing a blanket tariff together with country-specific levies in April 2025; India responded by widening its trade relationships, and the merchandise trade deficit widened to approximately US$333 billion in FY2025-26 from US$283 billion.12 The second was energy price volatility, which reaches the microfinance household by two direct routes: fuel is a disproportionate cost line for the transport-linked microenterprise, and energy prices feed agricultural input costs through diesel and fertiliser. The third was currency movement, with the rupee depreciating by approximately 5.4 per cent against the US dollar between April 2025 and January 2026, which raises the rupee cost of imported edible oil, fertiliser and energy, raises the cost of external commercial borrowings, and raises the rupee value of every remittance received.13
What is notable is how well the external account absorbed all three. For FY2025-26 as a whole, the current account deficit settled at US$25.2 billion, or 0.6 per cent of GDP, against US$22.9 billion and the same 0.6 per cent a year earlier, with the fourth quarter recording a surplus of US$7.1 billion.14,15 Foreign exchange reserves stood at approximately US$701 billion in January 2026, covering around eleven months of imports, and net services exports grew 15.3 per cent during April–December 2025.16,17 The external environment was turbulent; the external position was not.
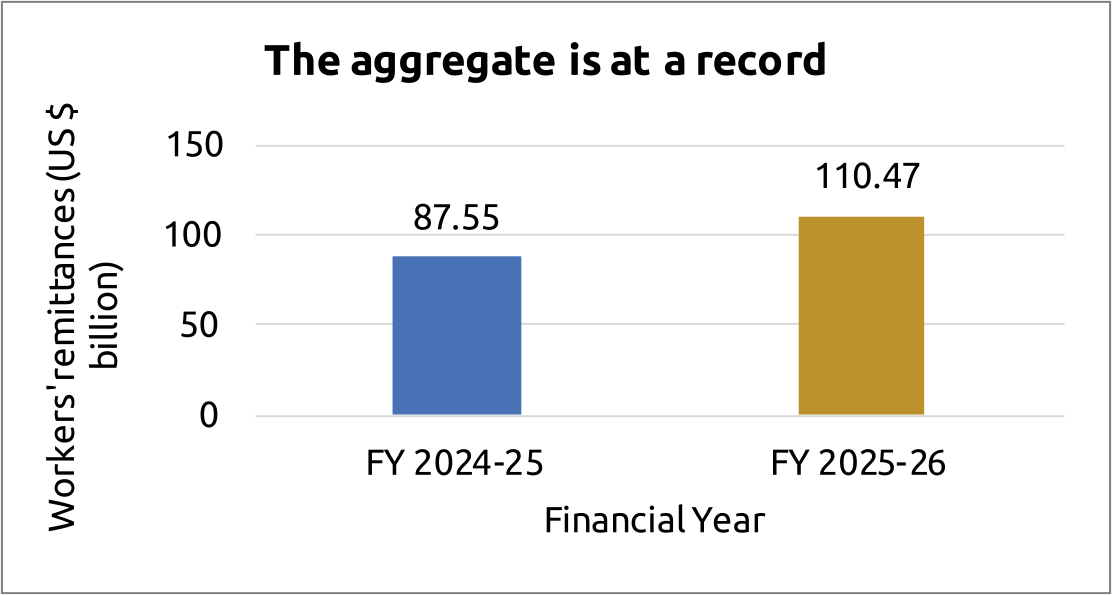
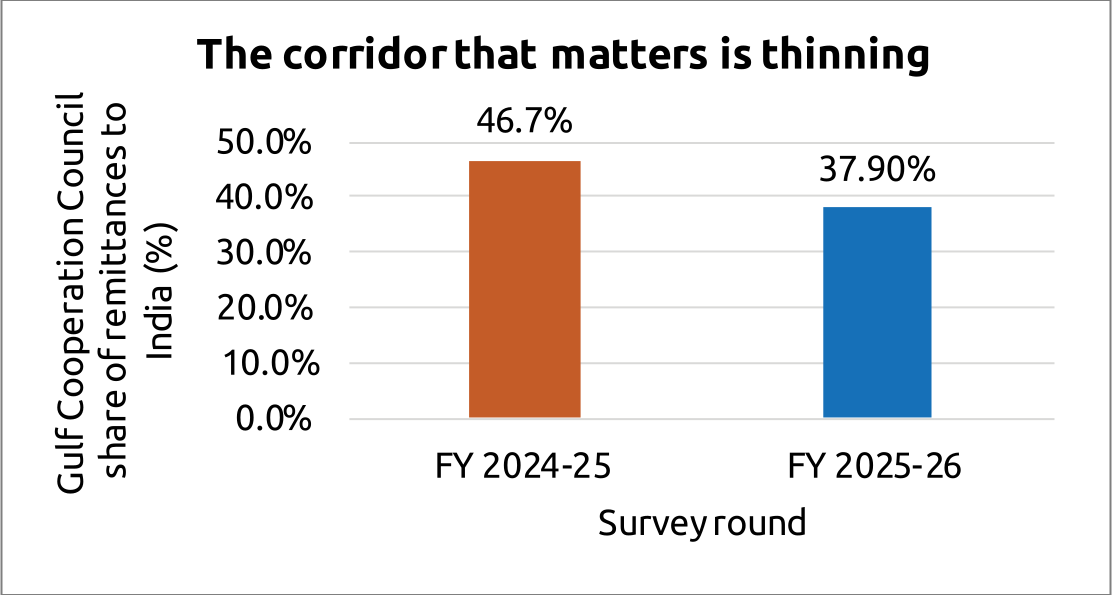
Remittances deserve separate treatment, because the picture that matters for microfinance is not the one the headline conveys. India remained the world’s largest recipient, and workers’ remittances rose to US$110.47 billion in FY2025-26 from US$87.55 billion the previous year.18,19 Beneath that aggregate sits a structural shift of direct consequence: the share originating in the Gulf Cooperation Council countries fell from 46.7 per cent in 2016-17 to 37.9 per cent in 2023-24, while the share from advanced economies rose.20 The Gulf corridor is the low-skilled, high-volume migration route, and it feeds precisely the eastern and northern districts where borrower density is highest. The sector therefore faces an unusual configuration: national remittances at a record, and the particular flow that reaches the microfinance household growing more slowly than the total. Figure 1.4 sets out both facts together.
Figure 1.4: Record remittances, shifting corridors21
(Total workers’ remittances and the Gulf share of inflows to India)
Gulf migration feeds the eastern and northern states where microfinance density is highest.
The practical instruction is that a lender operating in Bihar, Uttar Pradesh, Odisha or Jharkhand should treat Gulf labour-market conditions as a portfolio variable, not as foreign news. Remittance flows into a source district are observable now that transfers run on instant payment rails, and a district-level remittance indicator would give a genuine forward signal on household liquidity.
Trade, currency and remittances reach the household through prices and transfers. The next factor reaches it through the harvest itself, and it is the one the sector is least able to diversify away. Climate variability remains the most serious medium-term risk, and it has a property that distinguishes it from every other risk in a microfinance portfolio. Ordinary credit risk is idiosyncratic, and the group model diversifies it away; a climate event is covariate, affecting every borrower in a district simultaneously. Rising frequency is a concern; rising spatial correlation is a structural challenge to the risk model itself. Through 12 August 2026, cumulative rainfall ran 12 per cent below the long-period average, with the eastern and north-eastern region the region of highest borrower density — carrying a materially larger shortfall than the national figure conveys.22 The policy architecture has strengthened through crop insurance, the agricultural data stack and the restructured rural employment guarantee, whose allocation was raised by approximately 42.8 per cent over the revised estimate, a decision whose timing, ahead of a below-normal forecast, is worth noting.23
Climate determines rural household income in a bad year; the labour market determines it in an ordinary one. Open unemployment alone can be misleading because rural India often absorbs surplus labour through agriculture. In 2025, rural unemployment was 2.4%, but short-term and seasonal joblessness was much higher, making it more relevant for borrowers with frequent repayments.
Four indicators matter: the gap between usual- and weekly-status unemployment; agriculture’s 58.5% share of rural employment; youth unemployment of 9.9%, with 24.9% not in employment, education or training; and rising unpaid family work. Together, these suggest that low rural unemployment does not necessarily mean strong or stable household earning capacity—an important consideration for microfinance underwriting and repayment assessment.
Set out factor by factor, the pattern is unmistakable: almost every external and climatic line reverses between the two years. That is the substance of this paper’s argument. The sector’s difficulty in FY2024-25 and its recovery in FY2025-26 were driven substantially by the same set of channels moving first in one direction and then in the other. Sector-level discipline determined how well the institutions came through it. The channels determined what they had to come through. Table 1.2 sets out each external and climatic factor, the channel it travelled through, and its direction in each of the two years.
Table 1.2: External and climatic factors, and how they reached the microfinance household
| Factor | Channel | Direction, FY2024-25 | Direction, FY2025-26 |
|---|---|---|---|
| Global trade reordering and tariffs | Growth and income | Adverse: investment uncertainty | Absorbed; trade relationships widened |
| Crude and energy prices | Inflation; rural and agricultural | Adverse: input and transport costs | Favourable for most of the year, firming late |
| Fertiliser and farm input costs | Rural and agricultural | Adverse: margin compression at the farm gate | Eased alongside energy and a record harvest |
| Rupee depreciation | Inflation; monetary and financial | Mixed: import costs up, remittance value up | Mixed, with remittance value gain dominant |
| Remittances, aggregate | Growth and income | Supportive | Strongly supportive; record inflows |
| Remittances, Gulf corridor | Growth and income | Structurally thinning as a share | Continues to thin; a forward risk |
| Monsoon and agricultural output | Rural and agricultural; climate | Adverse in parts; uneven farm income | Strongly favourable; record output |
| Climate covariate events | Climate and shock | Adverse and locally severe | Contained; buffers intact, weaker season forecast |
| Rural labour market | Growth and income | Adverse: real wages compressed by inflation | Favourable: real wages gained from near-zero inflation |
12 See PIB, (April, 2026), ‘The cumulative exports (merchandise & services) during FY 2025-26 (April-March) is estimated at US$ 860.09 Billion, as compared to US$ 825.26 Billion in FY 2024-25 (April-March), an estimated growth of 4.22%’, https://www.pib.gov.in/PressReleasePage.aspx?PRID=2252272®=48&lang=2
13 See PIB, (January, 2026), ‘India Remains as the World’s Largest Recipient of Remittances, With Inflows Reaching USD 135.4 billion in FY25’, https://www.pib.gov.in/PressReleaseDetail.aspx?PRID=2219971®=3&lang=1
14 See PIB, (February, 2026), ‘India’s Real GDP Estimated to Grow By 7.4% in FY 2025–26, With Nominal GDP Growth at 8%’, https://www.pib.gov.in/PressReleasePage.aspx?PRID=2221389®=48&lang=2
15 See KNN India, (June, 2026), ‘RBI Data Shows India Records Current Account Surplus Of 0.7% Of GDP In Q4 FY26’, https://knnindia.co.in/news/newsdetails/economy/rbi-data-shows-india-records-current-account-surplus-of-07-of-gdp-in-q4-fy26
16 See PIB, (January, 2026), ‘India Remains as the World’s Largest Recipient of Remittances, With Inflows Reaching USD 135.4 Billion In FY25’, https://www.pib.gov.in/PressReleasePage.aspx?PRID=2219971®=48&lang=2
17 See RBI, ‘Annual Report 2025-26’, https://rbidocs.rbi.org.in/rdocs/AnnualReport/PDFs/0AR29052026F5B979AF274E445ABB1593EB226906335.PDF
18 See Ministry of Finance, Department of Economic Affairs, (January, 2026), ‘Economic Survey 2025-26’, https://www.indiabudget.gov.in/economicsurvey/doc/echapter.pdf
19 Reserve Bank of India. Remittances survey and workers’ remittance data. 2025-26.
20 See Gajbhiye, Dhirendra, Sujata Kundu, et.al., (March, 2025), ‘Changing Dynamics of India’s Remittances – Insights from the Sixth Round of India’s Remittances Survey’, https://rbi.org.in/scripts/BS_ViewBulletin.aspx?Id=23260
21 Sources: RBI balance of payments data and sixth remittances survey; Economic Survey 2025-26.
22 See PIB, (May, 2026), ‘Third Advance Estimates Reflect India’s Agricultural Strength; Union Minister Shri Shivraj Singh Chouhan Approves Record Crop Projections’, https://www.pib.gov.in/PressReleaseIframePage.aspx?PRID=2265965®=48&lang=2
23 See PRS Legislative Research, (February, 2026), ‘Union Budget 2026-27 Analysis’, https://prsindia.org/files/budget/budget_parliament/2026/Union_Budget_Analysis-2026-27.pdf
1.3 The Policy Response: How the Funding Channel Was Kept Open
The channels examined so far operate on the borrower’s income. The channel examined here operates on the lender’s funding, and during the period under review it came closer than any other to closing altogether. The contraction in microfinance portfolio between mid-2024 and the end of 2025 had two distinguishable causes, and distinguishing them mattered for the choice of remedy. The first was demand-side and deliberate: underwriting standards tightened, first under the household-level assessment and repayment-obligation limits introduced in 2022, then under the industry guardrails adopted from April 2025. Fewer households qualified, and that was the intended effect of a correct policy. The second was supply-side and unintended: bank lending to microfinance institutions became more cautious as asset quality deteriorated — the gross non-performing asset ratio of the microfinance segment of non-banking financial companies approximately doubled to 4.1 per cent — and the caution fell hardest on the smallest institutions, which have the least diversified funding.24 Since small institutions serve disproportionately the geographies that larger institutions have not entered, a funding constraint concentrated among them translates directly into a withdrawal of credit access from the least-served districts.
On 20 March 2026, the Government of India notified the Credit Guarantee Scheme for Microfinance Institutions 2.0. Its design repays close reading, because almost every parameter addresses a specific feature of the diagnosis rather than the problem in general. The scheme provides guarantee cover through the National Credit Guarantee Trustee Company, a subsidiary of the Small Industries Development Bank of India (SIDBI), to banks lending to microfinance institutions for on-lending within the Reserve Bank’s regulatory definition, with a corpus of ₹200 billion.25 Coverage is tiered inversely to institution size — 80 per cent of the amount in default for small institutions, 75 for medium and 70 for large, replacing a flat 75 per cent — which concentrates support where the funding constraint was tightest rather than distributing it in proportion to existing scale.26 Pricing is capped at both ends: bank lending to institutions at the benchmark rate plus 2 per cent, and institutions must on-lend at least one percentage point below their own average lending rate of the preceding six months, with a guarantee fee of 0.5 per cent per annum.27 The second cap is the analytically interesting one, because it ensures the benefit reaches the household rather than being retained in the intermediation margin. Funds are ring-fenced to incremental lending, and the scheme operates through automatic approval rather than case-by-case sanction, which matters because a guarantee that takes two quarters to obtain does not address a liquidity constraint arriving now.
In June 2026 the Government extended the scheme to 31 August 2026 and raised the maximum loan amount for large institutions from ₹3 billion to ₹10 billion, with approximately ₹85 billion sanctioned 42 per cent of the corpus.28,29 That utilisation figure deserves to be stated alongside the design, because the two together carry the actual lesson. An instrument whose parameters are this closely matched to the diagnosis had, some twelve weeks after notification, drawn down under a twenty-fifth of the capital committed to it. Three explanations are available and they call for different responses: that the original cap suppressed demand from the entities able to use the facility quickly, which the June revision implicitly accepted; that lending banks rather than microfinance institutions were the binding constraint, since a guarantee reduces loss given default but does not restore appetite; or that the on-lending rate condition, analytically the scheme’s best feature, is commercially unattractive to institutions still rebuilding margin. Establishing which applies, from the sanction data the trustee company holds, is the single most useful piece of policy evaluation available to this sector, and it is available at negligible cost. Two features of the episode deserve emphasis. The instrument is time-bound by construction: a guarantee scheme that becomes permanent alters the risk assessment of every subsequent lending decision and eventually substitutes for the underwriting it was meant to protect, while one that expires restores the ordinary discipline of the funding market. And the design works through pricing, not merely availability — most credit guarantee schemes address whether credit flows; this one also addresses at what price it reaches the ultimate borrower, converting a liquidity instrument into a transmission instrument. Table 1.3 sets out the structure.
Table 1.3: Credit Guarantee Scheme for Microfinance Institutions 2.0 — design and rationale
| Parameter | Provision | What it addresses |
|---|---|---|
| Corpus | ₹200 billion, guarantees through National Credit Guarantee Trustee Company (NCGTC) | Scale sufficient to shift bank risk perception |
| Guarantee coverage | 80% small, 75% medium, 70% large institutions | Concentrates support where the funding constraint bound hardest |
| Rate cap on wholesale lending | External Benchmark Lending Rate (EBLR) or Marginal Cost of Funds-Based Lending Rate (MCLR) plus 2 per cent | Prevents the guarantee being priced away by the lender |
| Rate condition on on-lending | At least 1 percentage point below the institution’s own prior six-month average | Ensures the benefit reaches the household, not the margin |
| Guarantee fee | 0.5 per cent per annum | Keeps the instrument close to cost |
| Tenure | Three years, including a one-year moratorium | Matches the recovery horizon rather than the quarter |
| End use | Incremental lending only, disbursed within three months | Prevents substitution for existing exposure |
| Approval | Automatic at the trustee company | Speed, since a delayed guarantee does not relieve a present constraint |
| Validity | To 31 August 2026 or ₹200 billion of guarantees | Deliberately time-bound rather than permanent |
Union Budget and its utilization
The Budget acts on several fronts at once. The Union Budget for 2026-27 sets the fiscal frame for the coming year. Total expenditure is estimated at ₹53.47 trillion, 7.7 per cent above the revised estimate, with capital expenditure rising 11.5 per cent and the fiscal deficit targeted at 4.3 per cent of GDP against a revised 4.4 per cent.30 Three allocation decisions bear directly on the transmission channels: the rural employment guarantee received an allocation approximately 42.8 per cent above the revised estimate; the National Rural Livelihoods Mission received ₹172.80 billion, an increase of approximately 20 per cent; and the women-specific (Part A) component of the gender budget was raised to approximately ₹1.07 trillion.31,32 The most consequential announcement, however, was not an allocation. Building on the Lakhpati Didi programme, the Budget proposed Self-Help Entrepreneur Marts — community-owned retail outlets within cluster-level federations of self-help groups, with the explicit intent of helping women move from credit-linked livelihoods to ownership of enterprises. The framing matters as much as the instrument, because it locates the next phase of policy at the point of market access, which is where credit-to-income conversion is either achieved or lost.
24 See RBI, ‘Report on Trend and Progress of Banking In India 2024-25’, https://rbidocs.rbi.org.in/rdocs/Publications/PDFs/0RTP291220258C89B9E5F3F240AEB82AC25A1707A8C6.PDF
25 Department of Financial Services, Ministry of Finance. Credit Guarantee Scheme for Microfinance Institutions 2.0, scheme notification. 20 March 2026.
26 See PIB, (March, 2026), ‘Government introduces Credit Guarantee Scheme for Microfinance Institutions-2.0 (CGSMFI-2.0)’, https://www.pib.gov.in/PressReleasePage.aspx?PRID=2243314®=48&lang=2
27 See note 29.
28 See PIB, (June, 2026), ‘Government Extends Validity of Credit Guarantee Scheme for Microfinance Institutions-2.0 (CGSMFI-2.0), Increases Loan Limits under the scheme’, https://www.pib.gov.in/PressReleasePage.aspx?PRID=2271200®=48&lang=2
29 Author’s calculation: ₹7.70 billion ÷ ₹200.00 billion × 100 = 3.85 per cent, shown rounded to one decimal place.
30 Ministry of Finance. Union Budget 2026-27 and Expenditure Budget documents. 1 February 2026; and PIB, (February, 2026), ‘Highlights of Union Budget 2026-27’, https://www.pib.gov.in/PressReleasePage.aspx?PRID=2221455®=48&lang=2.
31 See Bhagirath, (February, 2026), ‘Budget 2026-27: 20 per cent increase in allocation of Livelihood Mission for women empowerment’, https://www.downtoearth.org.in/governance/budget-2026-27-20-per-cent-increase-in-allocation-of-livelihood-mission-for-women-empowerment
32 See PIB, (February, 2026), ‘Allocation of Rs. 5.01 lakh crore reported for welfare of women and girls in the gender budget statement of FY 2026-27, an increase of 11.55% over the GBS allocation of Rs. 4.49 lakh crore in FY 2025-26’, https://www.pib.gov.in/PressReleasePage.aspx?PRID=2229460®=3&lang=1
1.4 Inflation: Beyond the Headline, to the Borrower’s Own Basket
Policy reaches the household through institutions, and therefore slowly. Prices reach it directly. Of the nine channels, inflation is the fastest and least leaky. It requires no intermediary and no lag; a price change reaches the household in the week it occurs. It is also the variable most commonly misread, because the headline index is not the index the borrower lives in. The Consumer Price Index (CPI) measures a representative basket, and a microfinance borrower household does not consume the representative basket: it consumes one weighted far more heavily towards food, fuel and transport and far less towards housing rent, durables and discretionary services. In the outgoing 2012-base series, food and beverages carried a weight of approximately 45.9 per cent in the all-India index, and for households in the lower expenditure deciles the food share is materially higher.33
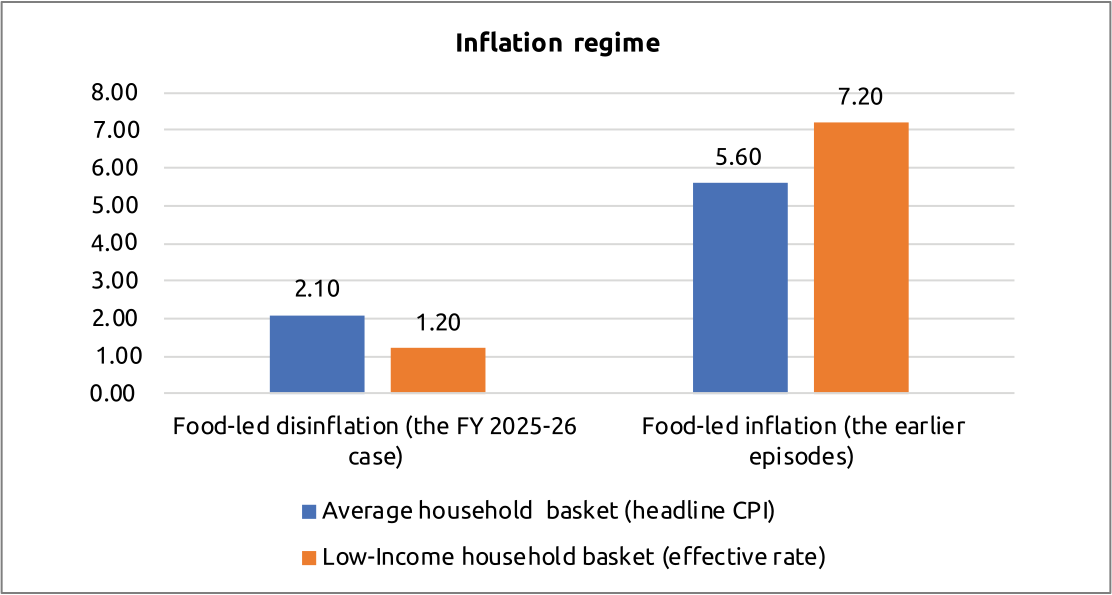
The index was rebased to 2024 with effect from February 2026, but the structural point survives the rebasing, since the divergence between an average basket and a low-income basket is a property of the income distribution rather than of any base year. That divergence generates a concept proposed here as an analytical instrument: the microfinance borrower’s effective inflation rate, defined as the rate of increase in the cost of the specific consumption basket of a low-income household, computed using that household’s own expenditure weights. Its construction is straightforward — published category-level rates are reweighted using expenditure shares characteristic of the borrower household. It has an important property frequently overlooked: it does not always run above the headline.
When inflation is food-led, the borrower’s effective rate exceeds the headline, and the household experiences greater compression than national commentary suggests. When disinflation is food-led, the relationship inverts, and the household experiences greater relief than the national statistic implies. Figure 1.5 sets out both cases.
Figure 1.5: The borrower’s basket cuts both ways
(Illustrative effective inflation rate under two regimes, average versus low-income weights)
Food-led disinflation places the borrower’s effective rate below the headline.
Illustrative computation by the author, applying category inflation rates to differing expenditure weights. Not an official series.
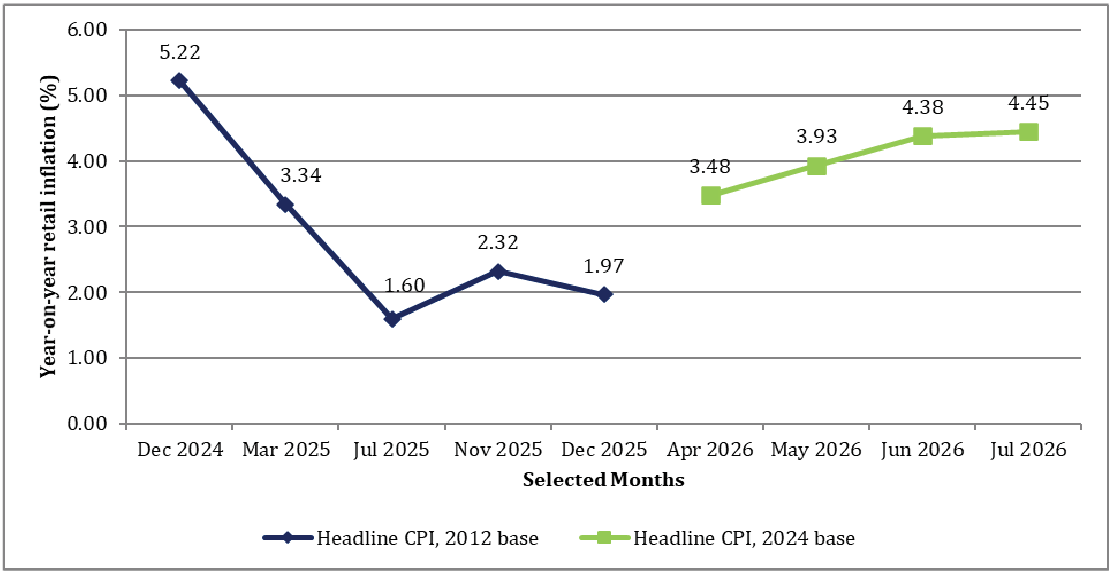
FY2025-26 was decisively the second case, and this is one of the most consequential and least remarked facts of the period. Retail inflation fell to levels not recorded in a generation, slipping below the lower bound of the tolerance band during the second quarter. In the closing months of calendar 2025, rural headline inflation touched approximately zero and briefly turned marginally negative, with the consumer food price index recording outright deflation in the rural sector. Figure 1.6 traces the path, including the series break at the February 2026 rebasing.
Figure 1.6: A generation’s low, then a normalisation34
(Headline retail inflation, selected months, December 2024 to July 2026)
Rural headline inflation touched approximately zero in late 2025 — below the all-India print shown here.
The composition of that disinflation is what makes it significant. It was concentrated in food, driven by two successive strong agricultural seasons and record output. A household spending half or more of its budget on food, in a year in which food prices were flat to falling, experienced an effective inflation rate below an already very low headline. Set against nominal income growth from a record harvest, employment-intensive services expansion and robust remittances, this produced the largest single-year real income gain for low-income households in the period under review. For a lender, the causal chain is direct: food disinflation reduces essential expenditure in real terms, which expands the household surplus, which strengthens debt-servicing capacity, which improves collection efficiency, which reduces portfolio at risk.35 Underwriting discipline explains part of the FY2025-26 improvement; the borrower’s household budget explains a great deal of the rest. An honest reading requires noting the lines that moved differently. Education inflation remained firm and is a rising share of the low-income budget, concentrated seasonally in the first quarter and among the most common stated purposes of borrowing at that point in the calendar. Health inflation likewise remained firm, and health expenditure is both large and unpredictable. Precious metals rose sharply, and for the low-income household gold is not a consumption item at all but the principal store of value — so rising prices strengthen the balance sheet by revaluing the buffer stock upward even as they raise the cost of replenishing it. Table 1.4 sets out the components of the borrower’s basket alongside their direction during the year.
Table 1.4: The borrower’s basket: approximate weights and direction during FY2025-26
| Expenditure category | Approximate weight, all-India basket | Direction of weight in a low-income basket | Direction of prices, FY2025-26 | Net effect on household surplus |
|---|---|---|---|---|
| Food and beverages | approx. 45.9% | Materially higher | Falling; rural food deflation in late 2025 | Strongly favourable |
| Fuel and light | approx. 6.8% | Higher | Broadly stable to soft | Favourable |
| Transport and communication | approx. 8.6% | Higher for enterprise households | Soft, firming late in the period | Mildly favourable |
| Housing | approx. 10.1% | Materially lower | Stable | Neutral |
| Education | approx. 4.5% | Rising over time | Firm | Unfavourable and seasonal |
| Health | approx. 5.9% | Rising over time | Firm | Unfavourable and unpredictable |
| Precious metals | Small | Buffer rather than consumption | Sharply higher | Favourable through buffer revaluation |
Note: weights shown are approximate all-India shares under the outgoing 2012-base series, indicated for structural illustration. The index was rebased to 2024 with effect from February 2026. Low-income basket direction is indicative and not an official series.
By May 2026 the picture had begun to normalise, and three further months of data have confirmed that reading in the direction the instrument predicted. Headline inflation rose to 4.38 per cent in June 2026 and 4.45 per cent in July, a nineteen-month high and the second consecutive month above the 4 per cent target after sixteen months below it, with food inflation at 5.52 per cent.36,37 More to the point for this readership, the rural-urban gap did not close but widened: rural headline inflation reached 4.84 per cent in July against 3.96 per cent urban, and rural food inflation 5.79 per cent against 5.05 per cent urban.38,39 Within the food group, the movement was concentrated in exactly the volatile, high-frequency items that dominate a poor household’s daily purchase, with onion inflation accelerating to 22.5 per cent from 4.7 per cent in a single month.40 The borrower’s effective inflation rate is therefore now running above the headline, and the disinflation dividend is being handed back at a measurable rate. The practical instruction is specific. A microfinance institution should not track headline CPI; it should construct and track its own borrowers’ effective inflation rate, using published category-level data reweighted by the expenditure shares observed in its own client base — data most institutions already collect at loan appraisal and simply do not aggregate. The value is no longer hypothetical. An institution that had constructed this measure in May 2026 would have read the widening rural-urban gap as an early signal; one tracking headline CPI alone would have seen a rate still comfortably inside the tolerance band and concluded that nothing had changed.
33 See RBI, (April, 2025), ‘Monetary Policy Report – April 2025’, https://rbi.org.in/scripts/BS_ViewBulletin.aspx?Id=23321
34 Source: Ministry of Statistics and Programme Implementation, monthly CPI releases. Series break at February 2026.
35 See Sa-Dhan, ‘The Bharat Microfinance Report 2025’, https://www.sa-dhan.net/wp-content/uploads/2025/10/Bharat-Microfinance-Report_FY_2024-25_compressed.pdf.
36 See PIB, (June, 2026), ‘Press Release of Consumer Price Index on Base 2024=100 For May, 2026’, https://www.pib.gov.in/PressReleasePage.aspx?PRID=2272112®=48&lang=1
37 See Das, Rajib, Radheshyam Verma, et.al., (August, 2026), ‘State of the Economy’, https://rbidocs.rbi.org.in/rdocs/Bulletin/PDFs/01ARTICLES25082026C265B792384D44BE8EE6DB2408F8626A.PDF
38 See ANI, (August, 2026), ‘Food prices may push inflation higher, but it will remain below RBI’s upper tolerance band: Experts’, https://www.aninews.in/news/business/food-prices-may-push-inflation-higher-but-it-will-remain-below-rbis-upper-tolerance-band-experts20260812190235/
39 See PIB, (August, 2026), ‘Press Release of Consumer Price Index on Base 2024=100 For July, 2026’, https://www.pib.gov.in/PressReleasePage.aspx?PRID=2298247®=48&lang=2
40 Rural-urban headline gap: 72 basis points in May 2026, 81 in June, 88 in July. All figures are provisional and on the 2024=100 base and are not comparable with the outgoing 2012-base series.
1.5 Employment, Wages and Livelihoods
Income is the first term of the household macro balance sheet, and employment is where income originates. Any labour market analysis for this readership must begin by acknowledging what it is analysing: the microfinance borrower household is rarely composed of employees but of own-account workers, casual labourers, unpaid family workers and circular migrants — categories conventional employment statistics were not primarily designed for. This produces a persistent measurement asymmetry in which formal employment is well measured and is not where most borrowers work, while informal self-employment is where most borrowers work and is measured with the greatest difficulty.
Labour force participation, particularly among rural women, has risen significantly, driven largely by self-employment. However, participation alone does not indicate economic empowerment; it may reflect enterprise formation, better measurement, distress participation or unpaid family work. The evidence points mainly to the first two.
For microfinance, the critical question is whether participation translates into economic agency. Five factors matter: type of work, regularity of income, control over earnings, ownership of productive assets, and household decision-making power. Progress has been strongest in participation and collective engagement, but women’s ownership of enterprise assets remains the weakest link between credit, income and lasting economic empowerment.
Table 1.5: Five questions about women’s work, and their underwriting counterparts
| Question about the work | Why it matters developmentally | Underwriting counterpart |
|---|---|---|
| Nature of the work | Distinguishes enterprise from unpaid family contribution | Whether an independent income stream exists at all |
| Level and regularity of earnings | Regularity determines whether income is usable | Fit between cash-flow pattern and repayment frequency |
| Control over income | Determines whether the loan reaches its intended user | Whether the obligor is the economic decision-maker |
| Ownership of enterprise assets | Determines whether gains accumulate into wealth | Durability of the enterprise and of the income stream |
| Position in household decision-making | Shifts with sustained income and collective membership | Resilience of repayment through household disagreement |
Two further developments matter. Circular migration remains one of the principal income transmission mechanisms into high-borrower-density districts, and it is now substantially digitised, which has compressed both the cost and the lag of the transfer and made remittance income visible as a transaction record for the first time. It is also seasonally patterned in knowable ways, so repayment schedules aligned to a source district’s liquidity profile perform better than schedules that ignore it. And platform-mediated work occupies an unusual position from a credit standpoint: its earnings are informal in security but formal in record, since the platform worker has no employment contract but possesses a complete, verifiable, digitally recorded income history. The traditional obstacle to lending against informal income was unverifiability, and platform work removes that obstacle without removing the underlying volatility.
The strategic implication is that the sector’s underwriting is presently calibrated to a labour market that is being superseded. Assessment built on the assumption of unverifiable informal income leaves on the table the growing share of borrower households whose income is now digitally observable — from platform work, digitised remittances, direct benefit transfers and enterprise receipts through instant payment rails. Building the capability to read those records, rather than any change in product terms, is the most valuable investment available to the sector over the coming three years.
Box 1.2: Judgment to Intelligence: How AI is Transforming MFI Credit Underwriting
For decades, microfinance has relied on human interaction for credit assessment. Credit officers typically meet borrowers, visit their households or businesses, assess income and repayment capacity, and combine these observations with available bureau and household information to make lending decisions. While this approach has enabled MFIs to serve customers with limited formal credit histories, it can also result in differences in judgement, inconsistent appraisal, and human bias.
For informal borrowers, particularly women, smallholders, and first-time borrowers, reliable digital data is often limited, making field appraisal an important part of credit assessment. However, such observations can be difficult to standardize, verify, and audit. In response, Pahal Financial Services explored technology to make credit underwriting more scientific, consistent, and evidence-based, while also improving operational efficiency.
An important capability acquired through Sub-K
One of the significant capabilities that came to Pahal through its acquisition of Sub-K Portfolio was VISyst (Virtual Intelligence System). The technology offered an opportunity to rethink the way customer interactions could be used in credit underwriting. Pahal has applied VISyst largely across its BC operations and now for its own portfolio as well, where the scale and distributed nature of customer acquisition and appraisal make consistency in underwriting particularly important. Rather than replacing the human interaction, VISyst seeks to make that interaction more structured and useful for decision-making.
Each appraisal is captured as a recorded video interaction and conducted through a standardized rubric. A multimodal AI layer analyses the interaction, checks consistency with the prescribed Standard Operating Procedures (SOPs), and converts relevant observations into structured credit insights. These observations can include factors such as asset ownership, housing conditions, the consistency between stated and observed repayment capacity, evidence of business activity, hesitation while discussing income, and the presence of a third party or proxy respondent. These are then considered alongside socio-economic, geo-spatial and officer-level variables to generate a composite risk score and confidence level. The objective is not to allow an algorithm to make decisions in isolation. Rather, technology helps bring consistency to the information on which the underwriter makes a decision.
What Pahal has gained
The experience with VISyst indicates benefits in both portfolio quality and operational efficiency. Early evidence shows that appraisal turnaround time has reduced by approximately 45%, while AI-assisted cohorts have recorded lower early-stage delinquency and NPAs compared with manually assessed cases. For Pahal, the technology can support more consistent underwriting, early risk identification, improved portfolio quality, and reduced administrative work for field teams.
Keeping technology responsible
AI in financial services must ultimately be built around customer trust. VISyst incorporates explicit informed consent before the interaction, with data protection principles including encrypted storage, role-based access, audit trails, purpose limitation and defined retention and deletion policies. Automated scoring operates alongside human oversight, with explainable outputs helping underwriters focus on cases requiring attention. This is particularly important in microfinance, where the customer relationship is central to the model. Technology should strengthen that relationship rather than make the credit process impersonal.
The road ahead: making underwriting more consistent, not less human
The emergence of AI in MFI underwriting reflects a shift towards making human judgement more consistent, evidence-based, and accountable rather than replacing it. Pahal aims to retain the human interaction central to microfinance while using AI to structure, verify, and analyse field information. As MFIs serve customers with limited formal credit histories, this approach can help convert field observations into reliable and actionable credit insights, supporting more responsible and disciplined lending.
Courtesy: Pahal Financial Services Pvt. Ltd.
1.6 What Helped, and What Did Not: A Causal Reading of the Cycle
The introduction set out the framework; the preceding sections applied it to the macroeconomic record. This section uses both to answer the question a sector publication exists to answer: of everything that happened between FY2022-23 and FY2025-26, what actually made the difference, and in which direction? The answer requires causal discipline rather than chronology, because the cycle had many features and only some of them were causes. Diagram 1 sets out the full chain.
DIAGRAM 1
The causal chain of the FY2024-26 microfinance cycle
Root Cause
- Household repayment capacity is a thin residual
- Sensitive to any movement in income, prices, obligation or shocks
Contributing Factors
- Rapid post-pandemic expansion
- Obligation building across lenders
- Information slower than circumstances
Triggers
- Food and rural inflation
- Uneven farm income
- External and climate shocks
- Local disruption to collections
Mechanisms
- Missed instalments
- PAR 30+, 2.1% → 6.2%
- Lender caution
- Borrowings ₹1.30 trillion → ₹0.86 trillion
- Disbursement falls
Consequences
- Household: access tightened
- Institutional: margin 9.49% → 7.99%
- OSS 122 → 104
- System: contained
What Changed the Course
- Household-level regulation, 2022
- Industry guardrails 2024 and 2025
- Favourable macro configuration
- Credit guarantee architecture, 2026
- Qualifying asset flexibility
The root cause was structural and long predates the cycle: household repayment capacity in this segment is a thin residual. When income is modest, essential expenditure is large and non-discretionary, and buffers are shallow, the surplus available for debt service is small in absolute terms and highly sensitive to movement in any of the other three terms of the identity. That is a permanent feature of lending to this segment, not a defect of any institution’s underwriting. The contributing factors were three, and they compounded: the rapid post-pandemic expansion, with the portfolio rising from approximately ₹2.90 trillion in 2022 to ₹3.52 trillion in 2023 and ₹4.15 trillion in 2024;41 the accumulation of household obligation across multiple lenders that accompanied it, since a household’s total obligation was visible to no single lender in full; and the incompleteness of the information architecture, with bureau reporting cycles measured in weeks against borrower circumstances that change in days, and self-help group borrowing recorded in a system entirely separate from institutional borrowing.
The triggers were macroeconomic and arrived from outside the sector — food inflation through FY2023-24 and into FY2024-25, uneven rural income conditions, and local disruptions that interrupted collection cycles. The mechanisms then propagated the shock in a traceable sequence. Compressed household surplus produced missed instalments; missed instalments produced rising portfolio at risk, moving beyond 30 days from 2.1 to 6.2 per cent and beyond 90 days from 1.6 to 4.8 per cent;42 rising portfolio at risk produced caution among the banks that fund microfinance institutions; that caution produced the funding contraction, with outstanding borrowings of micro lending institutions falling from ₹1.30 trillion to ₹859 billion, a decline of approximately a third; and the funding contraction produced reduced disbursement, which reduced portfolio, which compressed institutional economics further. Figure 1.7 shows where that shock landed.
Figure 1.7: Where the macro shock landed on the balance sheet43
(Funding and unit economics of micro lending institutions, FY2023-24 to FY2024-25)
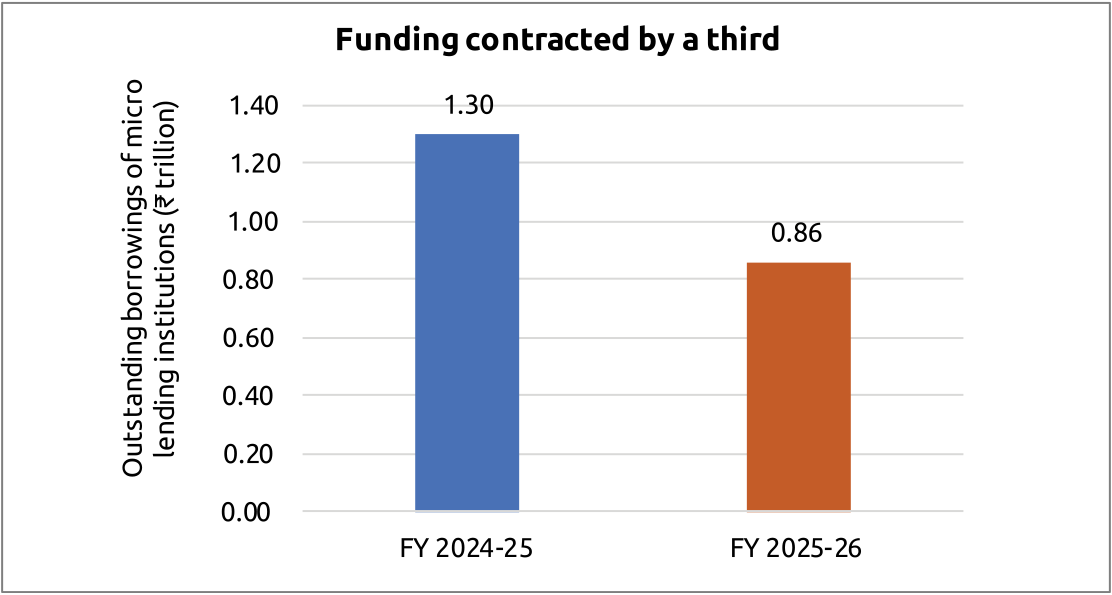
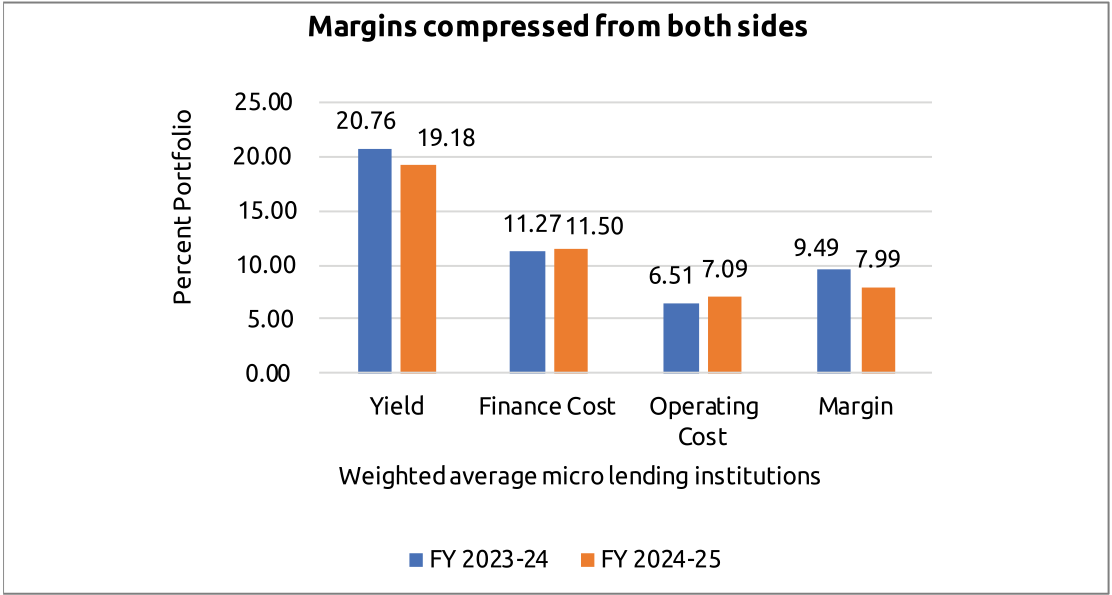
Operational self-sufficiency fell from 122 to 104 per cent as yield fell and both cost lines rose. The consequences were felt at three levels. At household level, credit availability tightened, and some households moved to other instruments. At institutional level the squeeze was severe and asymmetric: yield fell from 20.76 to 19.18 per cent while finance cost rose from 11.27 to 11.50 per cent and operating cost from 6.51 to 7.09 per cent, so that margin compressed from 9.49 to 7.99 per cent, operational self-sufficiency fell from 122 to 104 per cent, and return on assets moved from 4.06 per cent to −1.71 per cent.44 At system level the effect was contained, which is itself the most important finding: at no point did the sector’s difficulties threaten financial stability. Table 1.6 sets the chain out in summary.
Table 1.6: Causal structure of the FY2024-26 microfinance cycle
| Causal layer | What it was | Evidence |
|---|---|---|
| Root cause | Household repayment capacity is a thin residual, highly sensitive to movement in income, prices, obligations, or shocks | The surplus identity; expenditure share on food in low-income budgets |
| Contributing factor | Rapid post-pandemic portfolio expansion | Portfolio ₹2.90 trillion (2022) → ₹3.52 trillion (2023) → ₹4.15 trillion (2024) |
| Contributing factor | Household obligation accumulating across lenders, invisible to any one of them | Borrowers with five or more lenders at 2.8 per cent in March 2024 |
| Contributing factor | Information architecture slower than borrower circumstances | Reporting cycles in weeks; SHG borrowing outside the institutional record |
| Trigger | Food inflation compressing household surplus; uneven rural income; local disruptions | The fastest transmission channel, operating with no lag |
| Mechanism | Missed instalments → portfolio at risk → lender caution → funding contraction → reduced disbursement | PAR 30+, 2.1% → 6.2%; borrowings ₹1.30 trillion → ₹859 billion |
| Consequence, household | Credit availability tightened; substitution towards other instruments | Client base down 13 per cent in FY2024-25; gold-backed lending compounding rapidly |
| Consequence, institutional | Severe margin compression | Margin 9.49% → 7.99%; OSS 122% → 104%; RoA 4.06% → −1.71% |
| Consequence, system | Contained; no threat to financial stability | Banking system gross non-performing assets at multi-decadal lows throughout |
Naming the chain is only half the exercise; the key question is which interventions changed it. Five interventions made a measurable positive difference. Household-level regulation had the strongest structural impact, particularly the 2022 shift from product- to household-based assessment. Industry guardrails also worked: borrowers with two or fewer lenders increased from 90.5% to 92.6%, while those with five or more fell from 1.6% to 0.1%. The supportive macroeconomic environment, credit guarantees and regulatory flexibility on qualifying assets also strengthened sector stability.
However, three gaps remained. Information systems still do not provide a complete household-level view, particularly for SHG borrowing. Institutional support was uneven, with NBFC-MFIs receiving most of the funding. Household resilience products—insurance, savings and pensions also lagged behind the expansion of credit. The broader lesson is that Indian microfinance has developed a functioning corrective mechanism. Household leverage rose, regulation and industry guardrails responded, multiple lending declined, asset quality recovered, and growth resumed without systemic disruption. This corrective capacity—not any single March 2026 indicator is the sector’s most important asset for the next decade
41 Author’s calculation: (3.52 − 2.90) ÷ 2.90 × 100 = 21.4 per cent; (4.15 − 3.52) ÷ 3.52 × 100 = 17.9 per cent.
42 Author’s calculation: (859 − 1,300) ÷ 1,300 × 100 = −33.9 per cent.
43 Source: Sa-Dhan, Bharat Microfinance Report 2025 (data from 203 micro lending institutions covering more than 98 per cent of institutional business).
44 Note on the margin figures. The FY2023-24 figures reconcile exactly as yield less finance cost (20.76 − 11.27 = 9.49). The FY2024-25 figures do not: 19.18 − 11.50 = 7.68 percentage points, against the 7.99 per cent reported. The discrepancy of 0.31 percentage points suggests either a definitional change in the margin measure between the two years or a typographical error in one of the three underlying figures. The reported value is retained as published; the direction and approximate magnitude of the compression are unaffected either way.
1.7 Microfinance and Viksit Bharat: The Case for the Next Decade
India’s ambition to become a developed economy by 2047 ultimately depends on whether households build productive assets, stable incomes, financial resilience and market access. With 67.24 million microfinance clients and around 171 million households reached through SHGs, largely women, microfinance has a critical role in this transformation.
The sector’s next measure of success should move beyond outreach to credit-to-income conversion—the sustainable income generated by each additional rupee of credit. With 91% of loans supporting income-generating activities and the Lakhpati Didi initiative placing household income at the centre of policy, the focus must now shift from access to measurable outcomes. Four priorities are critical: integrate SHG borrowing into credit bureaus; assess repayment capacity rather than past repayment alone; strengthen savings, insurance and pension coverage; and expand market access, because credit enables production but income ultimately depends on markets. The goal is to make microfinance an instrument of sustained household income and productive capacity.
Table 1.7: A sequenced agenda for the sector
| Horizon | Action | Principal implementer | Expected effect |
|---|---|---|---|
| Immediate (0–12 months) | Bring SHG borrowing into credit information reporting | NABARD, credit information companies, Reserve Bank | Household obligation visible across both architectures for the first time |
| Immediate (0–12 months) | Publish a borrower effective-inflation indicator from client expenditure data | Sa-Dhan, member institutions | One to two quarters of lead time on collection stress |
| Short (1–2 years) | Add buffer depth and income-source correlation to appraisal | Member institutions, with Sa-Dhan common formats | Underwriting shifts from repayment record to repayment capacity |
| Short (1–2 years) | Make the funding gradient by institution size an explicit policy variable | Department of Financial Services, SIDBI, NABARD, banks | Credit reaches the geographies smaller institutions serve |
| Medium (2–4 years) | Attach credit products to market-access infrastructure including SHE Marts | Ministry of Rural Development, state missions, institutions | Credit converts into realised income rather than turnover |
| Medium (2–4 years) | Bring insurance, savings and pension coverage to credit-level scale | Institutions, IRDAI, PFRDA, Sa-Dhan | Shocks absorbed by buffers rather than by portfolios |
| Long (4–10 years) | Report credit-to-income conversion as a headline sector metric | Sa-Dhan, with NABARD and member institutions | The sector measured on income created, not credit extended |
| Long (4–10 years) | Develop climate-contingent products for covariate risk | Institutions, reinsurers, NABARD, Sa-Dhan | The one risk group lending cannot diversify becomes insurable |
One further thing is required of the sector, and it is not a policy measure. Indian microfinance has a habit of understating its own case. It reaches more low-income households than any other formal financial institution in the country. It reaches them overwhelmingly through women, and has done so for three decades. Roughly nine in ten of its loans finance income-generating activity. It operates in 35 States and Union Territories and in nearly 780 districts. It has built, in the self-help group federations, a community institutional infrastructure with few equivalents anywhere in the world. And it has just demonstrated that it can identify a build-up of household leverage, act on it collectively, absorb the cost, and return to growth on a cleaner base within roughly eight quarters. That is not a delivery channel. It is household financial infrastructure. The obligation that comes with the claim is to measure what it produces rather than what it disburses.
Conclusion
Across the nine channels, the four-year cycle reflects one mechanism operating in opposite directions. From FY2022-23 to FY2024-25, food inflation and uneven rural incomes squeezed household surpluses, weakened repayment, tightened lender funding and reduced credit access. In FY2025-26, these pressures reversed: better harvests, food disinflation, stronger employment and remittances, monetary easing and credit guarantees supported household incomes, funding and portfolio quality. The sector navigated the cycle well, but favourable external conditions also played a significant role.
The March 2026 position should therefore be seen as a starting point, not an endpoint. Inflation has begun rising again, the 2026 monsoon is below normal in high-borrower-density districts, and the guarantee facility has expired. While household balance sheets remain stronger, the next phase calls for closer measurement and borrower-level monitoring. Institutions that understand household cash flows, underwrite repayment capacity and measure the income generated by credit will be best placed to withstand the next cycle.