


Chapter 1.1India’s Macroeconomic Backdrop, FY2022-23 to FY2025-26
Real GDP grew 7.7 per cent in FY2025-26 against 7.1 per cent in FY2024-25, with real GDP at ₹323.12 trillion. For the microfinance analyst, composition matters more than the headline, and the composition was favourable: the trade, repair, hotels, transport, communication and storage block, in which a very large share of microfinance-financed enterprise sits, grew at approximately 11 per cent.


Indian Microfinance: Resilience, Responsibility & Inclusion Ramesh Srivatsava Arunachalam
Introduction
The health of Indian microfinance is not determined within Indian microfinance. It is determined in the space between the national economy and the household kitchen — in the distance a macroeconomic impulse must travel before it becomes, or fails to become, a repayment. This chapter maps that distance for the period from FY2022-23 to FY2025-26, four years in which the sector completed an entire cycle of expansion, correction and recovery while the country around it assembled the most favourable configuration of macroeconomic conditions for low-income households in more than a decade. The two events are ordinarily narrated apart, one as a story of underwriting discipline and the other as a story of growth and disinflation. The argument advanced here is that they are a single story, and that neither is intelligible without the other.
Two instruments carry that argument and are used throughout. The first is a transmission framework: macroeconomic conditions reach a borrower household through nine identifiable channels — growth and income, inflation and expenditure, monetary and financial, rural and agricultural, fiscal and social protection, financial inclusion, digital, climate and shock, and institutional and regulatory — each carrying its own lag, its own leakage and its own points of blockage, and each capable of compounding, offsetting or gating the others rather than acting alone. The second is the household macro balance sheet, which holds that the surplus available for debt service is what remains of total household income after essential expenditure, debt servicing and shock costs, so that portfolio quality is a derivative of household cash-flow resilience and of nothing else. What follows applies to both records. Sections 1.1 and 1.2 set out the macroeconomic and external backdrop; Section 1.3 examines the policy response that kept the funding channel open; Sections 1.4 and 1.5 take the two terms of the identity that moved furthest, prices and income, and read them from the household’s side; Section 1.6 asks what actually made the difference, and in which direction; and Section 1.7 states what the sector should now undertake to measure.
1.1 India’s Macroeconomic Backdrop, FY2022-23 to FY2025-26
This chapter asks of each significant indicator the only question that justifies its presence in a microfinance publication: why does this matter to a low-income household? One methodological point precedes the numbers. In February 2026, the national accounts were rebased from 2011-12 to 2022-23, with improved capture of informal-sector activity, so multi-year narratives constructed across the revision require care, and several of the activities better captured under the new base are precisely those microfinance borrowers operate. Real Gross Domestic Product (GDP) grew 7.7 per cent in FY2025-26 on the provisional estimates released in June 2026, against 7.1 per cent in FY2024-25 on the same basis, with real GDP at ₹323.12 trillion.1 For the microfinance analyst, composition matters more than the headline, and the composition was favourable: the trade, repair, hotels, transport, communication and storage block, in which a very large share of microfinance-financed enterprise sits, grew at approximately 11 per cent. Manufacturing grew 10.7 per cent; agriculture grew 3.0 per cent on a record production base; private final consumption expenditure grew 7.7 per cent against 5.8 per cent the previous year; and gross fixed capital formation grew 8.2 per cent.2 Figure 1.1 sets out the composition.
Figure 1.1: The growth that reaches the household3
(Composition of Indian growth, FY2025-26, provisional estimates, 2022-23 base)
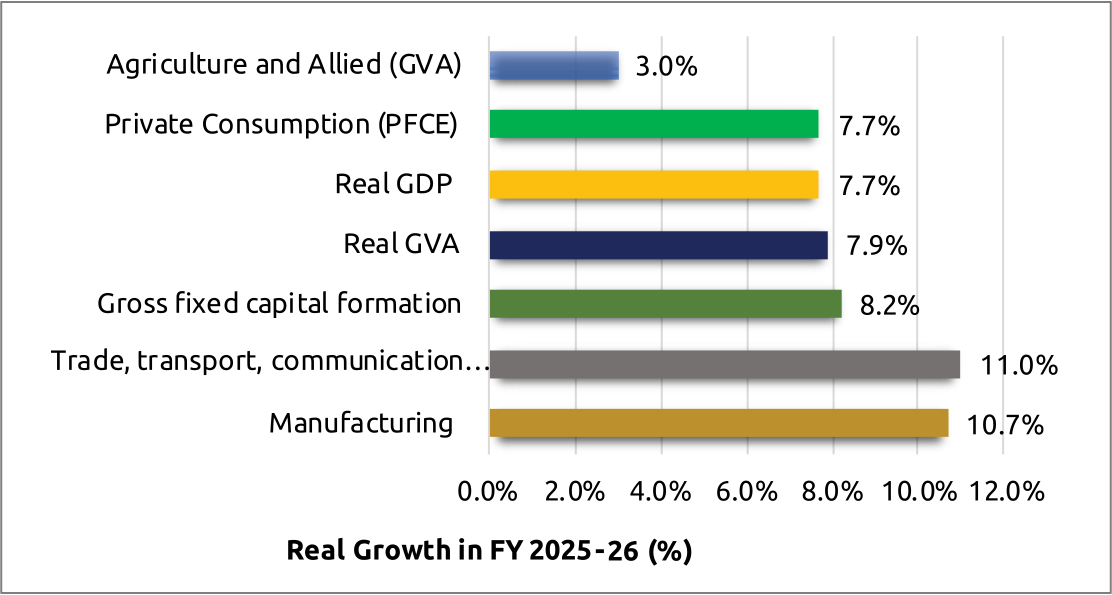
The labour-absorbing trade and transport block — where most microfinance-financed enterprises sit — led the expansion.
Two causal chains follow, and both are short. Construction and public capital expenditure generate migrant employment, which generates remittances, which raise rural household cash flows with a lag measured in weeks rather than quarters. Growth in trade, transport and hospitality raises informal enterprise turnover, and it operates in both directions at once: when that block grows, the borrower benefits twice, once as a proprietor whose own sales rise and once as supplier to and customer of neighbours whose sales also rise. Village-level enterprise income is a network property rather than an individual one. Public capital expenditure reaches the household by three routes, of which only the first is usually noted: employment during construction; asset creation, since a road that reduces the time and cost of reaching a market raises the price the producer realises, permanently; and a third that alters the lending frontier itself, since improved connectivity, electrification and water availability change what enterprises are viable in a village at all — and those new categories require larger and longer-tenor credit than the classical microfinance product provides.
Policy Rates
The policy repo rate was reduced from 6.50 per cent to 5.25 per cent in four steps between February and December 2025 and held at each of the four subsequent reviews, most recently on 5 August 2026, with a staggered 100 basis point reduction in the cash reserve ratio from September 2025 releasing roughly ₹2.5 trillion of primary liquidity.4 The easing cycle is complete for the present. Figure 1.2 sets out the path.
Figure 1.2: The easing cycle, and the pause that followed5
(Policy repo rate, January 2025 to August 2026)
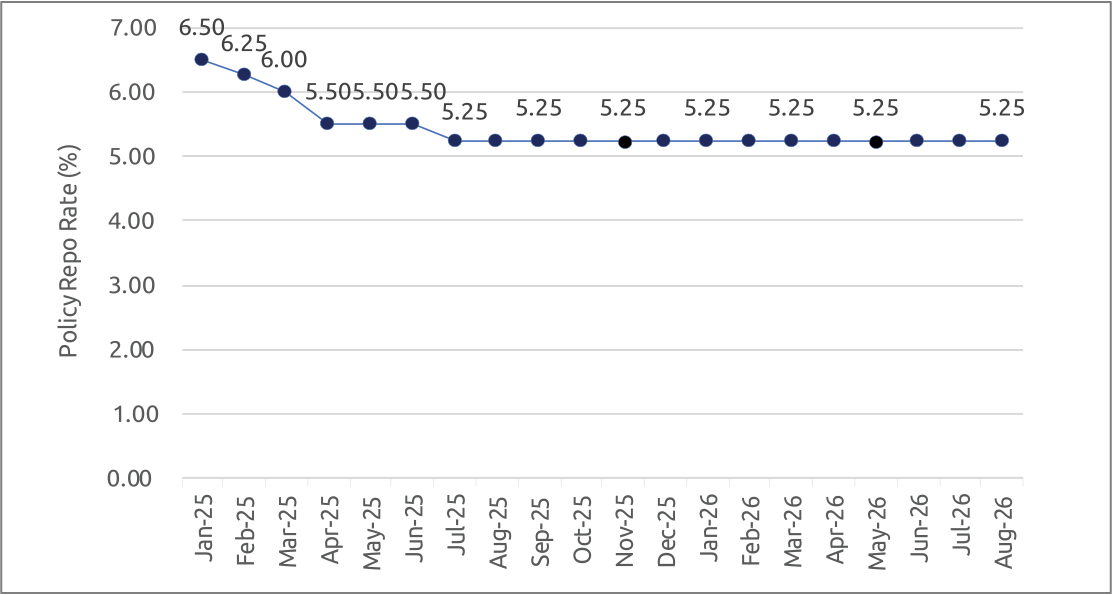
For microfinance, the binding constraint in this channel is availability of funding, not its price.
The significance of this easing runs primarily through availability rather than price. Bank lending remained the dominant funding source for non-banking financial company-microfinance institutions, at approximately two-thirds of borrowings outstanding at March 2026. An easing cycle therefore reaches the sector principally by improving the willingness and capacity of banks to lend to it, and only secondarily by reducing the rate at which they do so.
If monetary policy set the terms on which credit reached the sector, the agricultural cycle set the terms on which income reached the household. Two consecutive strong agricultural seasons defined the rural economy of the period. The 2025 south-west monsoon was above normal, reservoir storage stood above 91 per cent of live capacity in October 2025, and food grain production for 2025-26 reached a record 376.55 million tonnes against 357.73 million tonnes the previous year, an increase of approximately 5.3 per cent, with wheat at a record 120.65 million tonnes.67 The India Meteorological Department’s forecast for 2026 was below normal at 90 per cent of the long period average, the first such forecast in over a decade; cumulative rainfall stood 12 per cent below the long period average on 12 August 2026; and moderate El Niño conditions prevailed and were expected to strengthen.89 Figure 1.3 sets the two facts side by side.
Box 1.1: Data Privacy and DPDP Readiness: Strengthening Customer Trust Through Responsible Data Governance
As digital adoption accelerates in microfinance, protecting customer data has become both a business imperative and a regulatory priority. Spandana Sphoorty Financial Ltd. has launched a comprehensive Data Privacy and Digital Personal Data Protection (DPDP) Readiness Initiative to strengthen data governance, enhance customer trust, and align its operations with the Digital Personal Data Protection Act, 2023.
The initiative includes an internal assessment followed by an independent gap assessment covering data inventory and data flow mapping, consent management, data principal rights, privacy governance, third-party risk management, data retention practices, security controls, breach management, privacy notices, and organizational awareness. The findings will provide a structured roadmap for implementing DPDP core controls and strengthening the institution’s privacy framework.
A key focus of the programme is identifying and classifying personal data across business functions and technology platforms to improve visibility over data processing activities and enhance privacy controls. Existing policies and procedures are also being reviewed to incorporate privacy-by-design principles, covering consent management, data retention, third-party oversight, incident management, and customer grievance handling.
Recognizing that data privacy is an organizational responsibility, Spandana Sphoorty is also strengthening employee awareness through training programmes that promote responsible data handling and privacy compliance across all levels of the organization.
Key Outcomes
- Comprehensive assessment of data privacy practices and DPDP readiness.
- Structured roadmap for implementing DPDP core controls.
- Improved data governance through enhanced policies, privacy controls, and data lifecycle management.
- Strengthened management of third-party data processing and privacy risks.
- Increased employee awareness and accountability for responsible data handling.
- Enhanced customer trust, operational resilience, and regulatory preparedness.
Courtesy: Spandana Sphoorty Financial Ltd.
1 See Ministry of Statistics & Programme Implementation (MoSPI), Press Note on Provisional Estimates of Annual Gross Domestic Product for 2025-26. Quarterly Estimates of Gross Domestic Product for the Fourth Quarter (January-March) of 2025-26, https://www.mospi.gov.in/uploads/latestReleases/latest_release_1780655857536_5ac01869-ca4a-422d-b7a7-57b81da60932_Press_Note_on_GDP_Estimates_for_Q4_2025-26_and_PE_FY_2025-26_F.pdf.
2 An earlier figure of approximately 7.0 per cent was the January 2026 First Advance Estimate on the outgoing 2011-12 base, and referred to manufacturing and construction combined. On the 2022-23 base used throughout this section, manufacturing grew 10.7 per cent in FY2025-26 against 9.3 per cent in FY2024-25. Mixing the two series is precisely the error the rebasing caution earlier in this section warns against.
3 Source: National Statistical Office, Provisional Estimates of Annual GDP for FY 2025-26, 5 June 2026. Trade-transport-hotels figure approximate.
4 See RBI, (August, 2026), ‘Minutes of the Monetary Policy Committee Meeting, August 3 to 5, 2026’, https://www.rbi.org.in/Scripts/BS_PressReleaseDisplay.aspx?prid=63403.
5 Source: RBI, Monetary Policy Committee Statements. Stance neutral from June 2025.
6 See PIB, (May, 2026), ‘Third Advance Estimates Reflect India’s Agricultural Strength; Union Minister Shri Shivraj Singh Chouhan Approves Record Crop Projections’, https://www.pib.gov.in/PressReleaseIframePage.aspx?PRID=2265965®=48&lang=2.
7 Author’s calculation: (376.55 − 357.73) ÷ 357.73 × 100 = 5.26 per cent, shown rounded to one decimal place.
8 Position as at 12 August 2026. Cumulative departure at that date remained inside the India Meteorological Department’s “normal” classification band, but the distribution was materially uneven, with the eastern and north-eastern region carrying the largest deficit through the first half of the season. Readers should note that the season closes on 30 September and the final figure will differ.
9 See PIB, (August, 2026), ‘Parliament Question: South-West Monsoon Forecast’, https://www.pib.gov.in/PressReleasePage.aspx?PRID=2298071®=48&lang=2.
Figure 1.3: Rural India enters FY2026-27 with full buffers10
(Food grain production and monsoon performance, 2024-25 to 2026)
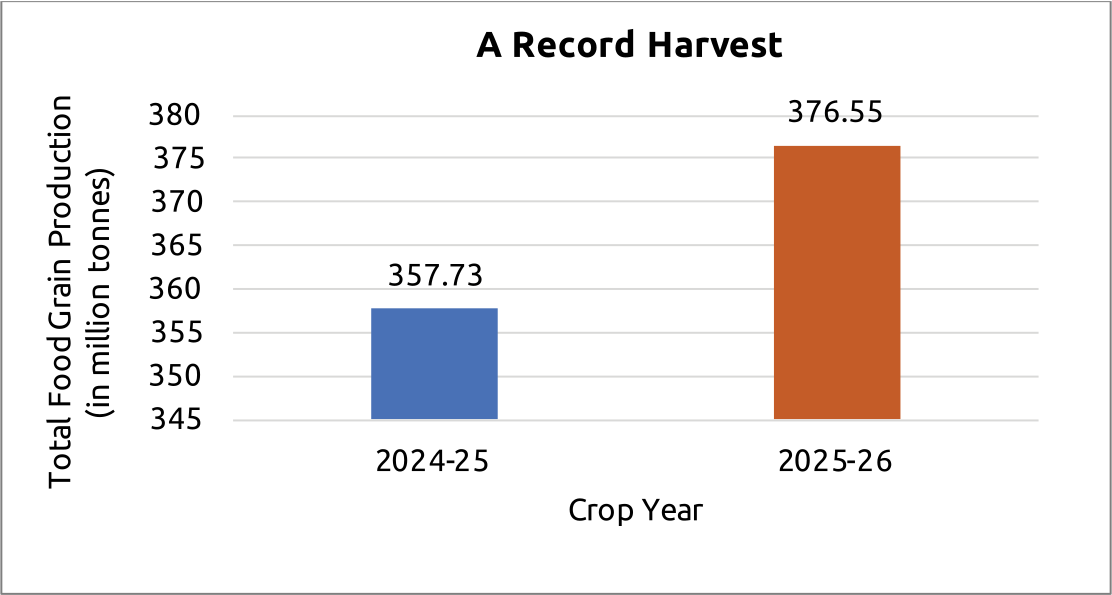
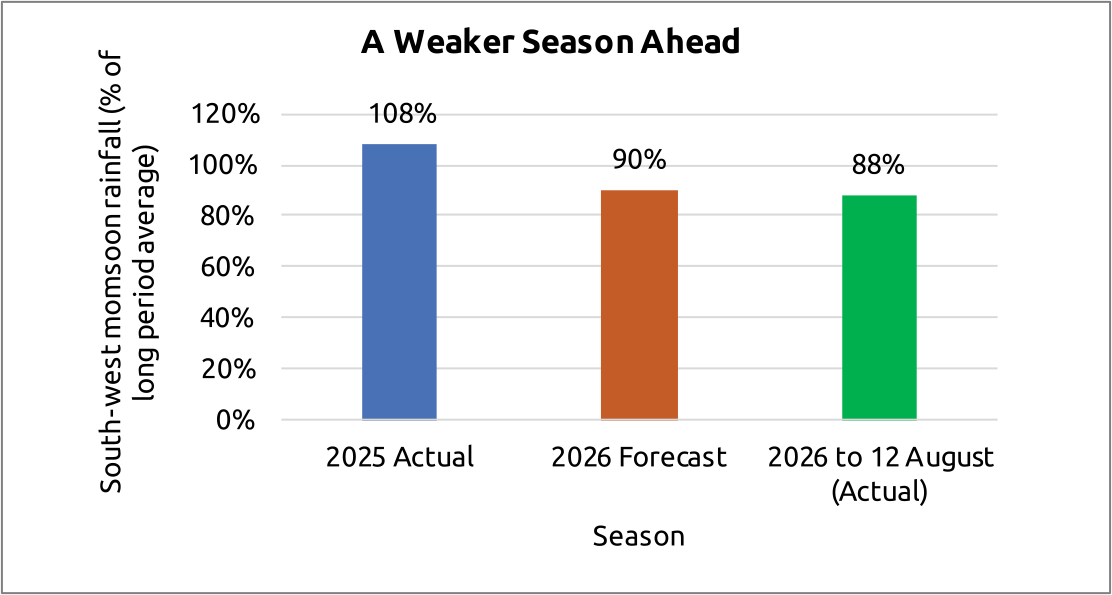
The question for the coming year is not production but whether buffers absorb a weaker season. The correct reading of this two-year sequence is that rural India entered FY2026-27 with unusually strong household balance sheets, full reservoirs and large public stocks, which is to say, with precisely the buffers that determine whether a weaker season becomes a household event or remains merely a weather event. That is the difference between a monsoon shortfall that appears in agricultural statistics and one that appears in a microfinance portfolio two quarters later. Fiscal consolidation continued alongside a sustained capital expenditure programme, with the deficit narrowing while public investment held the more favourable of the two available paths from the standpoint of low-income households, because the alternative form of consolidation operates through precisely the transfer and programme lines on which household resilience depends.
Placed against the household macro balance sheet, the backdrop of FY2025-26 supported every term of the identity at once. The appropriate conclusion is confident but precise: this was the most favourable macroeconomic environment for the Indian microfinance household in the four years under review, and probably in more than a decade. The sector’s recovery in portfolio quality is therefore not solely, and probably not even mainly, an achievement of sector-level discipline; it is the joint product of that discipline and an exceptionally supportive configuration. Stating this plainly is not a diminishment - a favourable environment does not repair a book by itself — but the necessary basis for the more useful question, which is which of the improvements achieved were structural and will persist. Table 1.1 sets out the principal macroeconomic indicators and their relevance to the household.
Table 1.1: Selected macroeconomic indicators and their relevance to the microfinance household
| Indicator | FY 2024-25 | FY 2025-26 | Why it matters to the household |
|---|---|---|---|
| Real GDP growth | 7.1% | 7.7% (provisional) | Sets the outer bound; composition determines who benefits |
| Trade, transport, hotels, communication | — | approx. 11% | The block in which the borrower enterprise itself operates |
| Manufacturing | — | 10.7% | Wage employment and migrant absorption |
| Agriculture and allied (GVA) | 4.2% | 3.0% | Moderate growth on a record production base |
| Private final consumption | 5.8% | 7.7% | Local demand for the microenterprise’s output |
| Gross fixed capital formation | — | 8.2% | Construction employment, then permanent productivity gain |
| Policy repo rate (year-end) | 6.25%11 | 5.25% | Reaches the borrower through funding availability |
| Food grain production | 357.73 million tonnes | 376.55 million tonnes | Farm income, food prices and buffer stock adequacy |
| Headline retail inflation | Moderating through the year | Below tolerance band for much of the year | The single fastest determinant of household surplus |
Note: FY2025-26 figures are provisional or first-estimate positions. National accounts rebased to 2022-23 with effect from February 2026; figures are not directly comparable with earlier published series on the 2011-12 base. Sectoral growth figures are shown to one decimal place where officially published and as approximations otherwise.