


Chapter 3 - Section 3.4Loan Outstanding
The On-Balance Sheet/ On Book portfolio represents loans that Micro Lending Institutions (MLIs) have on their own books, funded through their own capital and borrowings, as against the loans originated and assigned or securitised to other lenders, but managed by the original institution. The portfolio originated through Business Correspondent or co-lending arrangements also forms part of managed assets and does not form part of the on-book, except the portion of share owned by the originator under co-lending arrangement.


3.4 Loan Outstanding
3.4.1 On-Balance Sheet Portfolio of MLIs
The On-Balance Sheet/ On Book portfolio represents loans that Micro Lending Institutions (MLIs) have on their own books, funded through their own capital and borrowings, as against the loans originated and assigned or securitised to other lenders, but managed by the original institution. The portfolio originated through Business Correspondent or co-lending arrangements also forms part of managed assets and does not form part of the on-book, except the portion of share owned by the originator under co-lending arrangement.
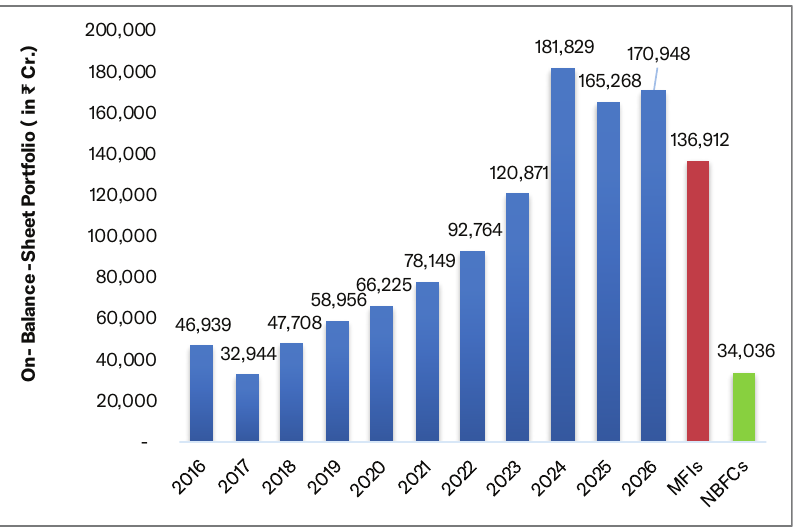
As of March 31, 2026, the On-Balance Sheet Portfolio stood at ₹1,70,948 Cr., making it the dominant share of the sector’s overall lending activity. It has grown by 3% year-on-year from ₹1,65,268 Cr. in March 2025. In the case of Off-Balance Sheet portfolio arrangements, especially with co-lending, borrowers benefit due to lower rates of interest or getting facilities from financial institutions with a local touch and feel.
Figure 3.5: On-Balance-Sheet Loan Portfolio of MLIs (in ₹ Cr.) –Yearly Trend and Category–wise Breakup as of March 2026
A further segregation of the On-Balance-Sheet Loan Portfolio based on the legal forms of MLIs and the size of MLIs is given below:
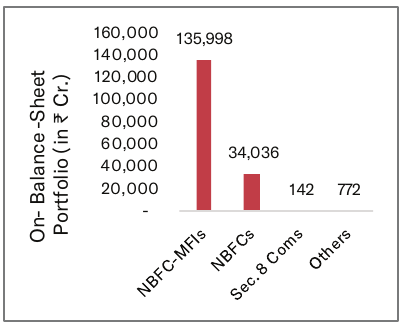
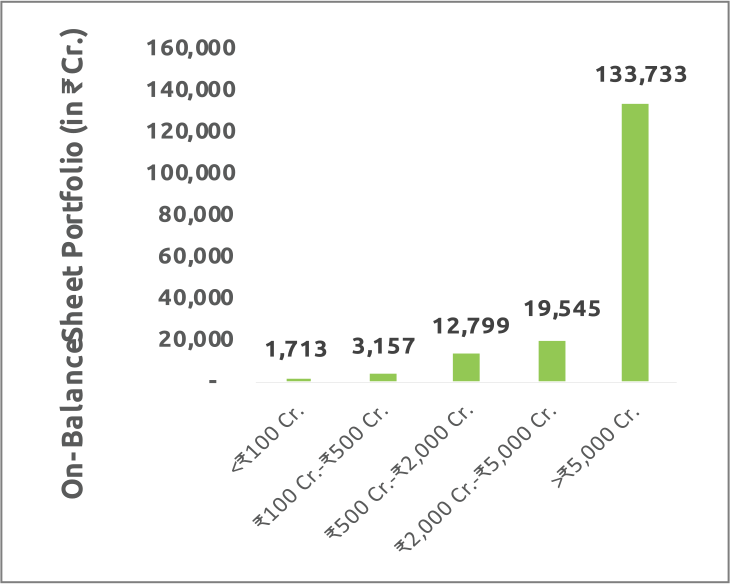
Note: In the decadal trend graph of the On-Balance Sheet Portfolio (2016–2026) shown above, the On-Balance Sheet Portfolio for each year is represented by blue bars, covering all Micro Lending Institutions (MLIs). For FY 2025-26, however, the total On-Balance Sheet Portfolio of ₹1,70,948 Cr. has been further disaggregated to provide clearer insights. The breakdown highlights MFIs (NBFC-MFIs, Societies, Sec. 8 Coms, Trusts, MACS, or Cooperatives) shown in red, NBFCs in green, and Pvt. Ltd. Coms in orange, offering a clearer picture of the growth pattern of MFIs.
3.4.2 Off-Balance Sheet/Managed Loan Portfolio of MLIs
The borrowers typically seek loans for diverse purposes—ranging from loans for emergency and consumption needs to small businesses, working capital, and housing are met through such arrangements. Mainstream lenders often are unable to meet these demands due to the small loan sizes, lack of collateral, and procedural complexities. MLIs have filled this gap, playing a crucial role in serving the financially excluded.
MLIs use securitisation and direct assignment to mobilise resources for portfolio growth. Some institutions also operate as Business Correspondents (BCs), enabling them to originate and service loans on behalf of Banks and Financial Institutions without having to bother for raising funds for their operations and expanding business. It basically provides margin, which adds to their income through fees. These arrangements also support lenders in meeting priority-sector objectives and provide MLIs with an income stream, while helping address funding and capital constraints. Although MLIs manage the portfolios operationally, the assets do not sit on their books, and they report them as Off-Balance-Sheet portfolios.
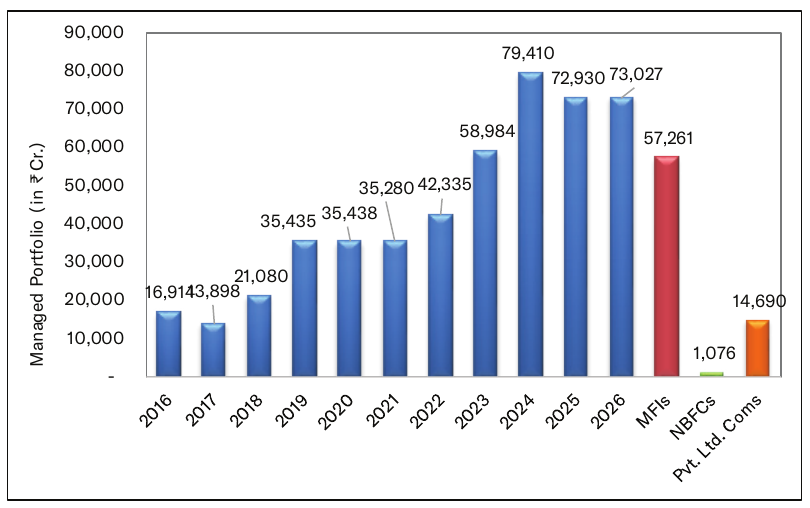
As of March 31, 2026, 99 MLIs reported a Managed Portfolio of ₹73,027 Cr., which are classified as Off-Balance-Sheet portfolio, compared with ₹72,930 Cr. at the end of FY 2024-25. The Managed Portfolio has grown by a meagre 0.1% during FY 2025-26. Figure 3.6 presents the category-wise distribution of this portfolio.
Figure 3.6: Managed/Off-Balance-Sheet Loan Portfolio of MLIs (in ₹ Cr.) –Yearly Trend and Category–wise Breakup as of March 2026
A further segregation of the Managed Loan Portfolio based on the legal forms of MLIs and the size of MLIs is given below:
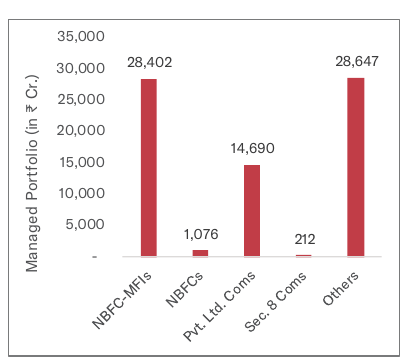
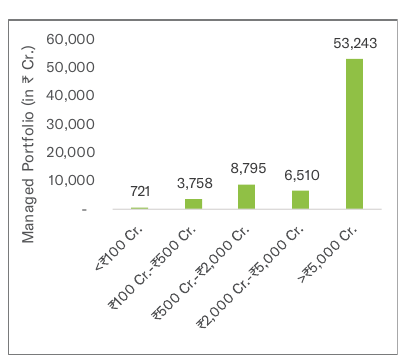
Note: In the decadal trend graph of the Managed Portfolio (2016–2026) shown above, the Managed Portfolio for each year is represented by blue bars, covering all Micro Lending Institutions (MLIs). For FY 2025-26, however, the total Managed Portfolio of ₹73,027 Cr. has been further disaggregated to provide clearer insights. The breakdown highlights MFIs (NBFC-MFIs, Societies, Sec. 8 Coms, Trusts, MACS, or Cooperatives) shown in red, NBFCs in green, and Pvt. Ltd. Coms in orange, offering a clearer picture of the growth pattern of MFIs.
3.4.3 Business Correspondent (BC) Portfolio of MLIs
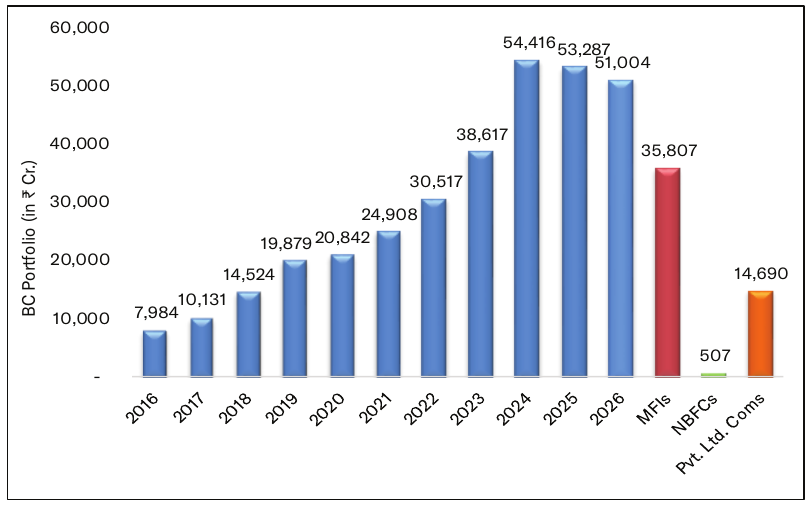
Business Correspondents (BCs) appointed by Banks and Financial Institutions help in sourcing clients, managing the accounts, and servicing the collections on their behalf. Initially, only NGO-MFIs were permitted to function as BCs. The RBI later extended this facility to incorporated entities also, thereby allowing NBFC-MFIs to act as BC. Consequently, an increasing number of MLIs, particularly smaller ones facing challenges in raising capital, have adopted the BC model to expand their business and generate income. As of March 31, 2026, 84 MLIs are functioning as BC agents, with the total loan portfolio under the BC model standing at ₹51,004 Cr., registering a decline of (-4%) in FY 2025-26. The BC portfolio accounts for nearly 70% of the Managed Portfolio.
The distribution of the BC portfolio among different categories of MLIs is displayed in Figure 3.7:
Figure 3.7: BC Loan Portfolio of MLIs (in ₹ Cr.) and Category–wise Breakup as of March 2026
A further segregation of the Business Correspondent Loan Portfolio based on the legal forms of MLIs and the size of MLIs is given below:
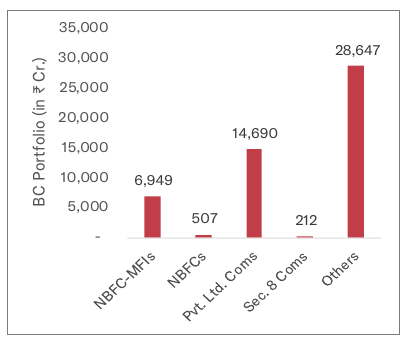
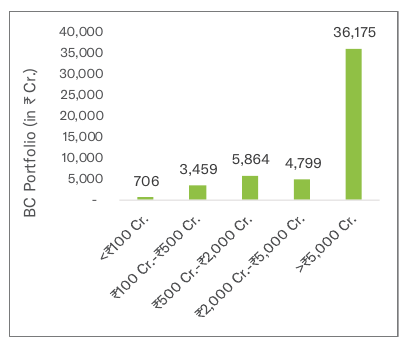
Note: In the decadal trend graph of the BC Portfolio (2016–2026) shown above, the BC Loan Portfolio for each year is represented by blue bars, covering all Micro Lending Institutions (MLIs). For FY 2025-26, the total BC Portfolio of ₹51,004 Cr. has been further disaggregated to provide deeper insights. The breakdown shows MFIs (NBFC-MFIs, Societies, Sec. 8 Coms, Trusts, MACS, or Cooperatives) in red, NBFCs in green, and Pvt. Ltd. Coms in orange, offering a clearer view of the growth trend of MFIs.
3.4.4 Qualified and Non-Qualified Loan Portfolio:
Table 3.3: Qualified and Non-Qualified Portfolio
| On-Balance-Sheet Portfolio (in ₹ Cr.) | Off-Balance Sheet Portfolio (in ₹ Cr.) | ||
|---|---|---|---|
| ₹1,70,948 Cr. (70%) | ₹73,027 Cr. (30%) | ||
| Qualified Loan Portfolio and % share within On-Balance-Sheet Portfolio | Non-Qualified Loan Portfolio and % share within On-Balance-Sheet Portfolio | Qualified Loan Portfolio and % share within Off-Balance-Sheet Portfolio | Non-Qualified Loan Portfolio and % share within Off-Balance-Sheet Portfolio |
| ₹1,47,099 Cr. | ₹23,849 Cr. | ₹63,420 Cr. | ₹9,606 Cr. |
| 86% | 14% | 87% | 13% |
Out of the total portfolio of reported MLIs, the On-Balance Sheet Portfolio comprised ₹1,70,948 Cr. (70%), and the Off-Balance Sheet Portfolio comprised ₹73,027 Cr. (30%), indicating that more than two-thirds of the portfolio continues to be held on the books of lending institutions. Within the On-Balance-Sheet portfolio, qualified assets accounted for ₹1,47,099 Cr. (86%), while non-qualified assets stood at ₹23,849 Cr. (14%). Similarly, the Off-Balance Sheet Portfolio exhibited a comparable composition, with qualified assets amounting to ₹63,420 Cr. (87%) and non-qualified assets at ₹9,606 Cr. (13%). The consistently high share of qualified assets across both portfolio categories reflects strong alignment with the applicable qualifying asset norms and prudent portfolio management practices among reporting institutions.
3.4.5 Segments of MLIs’ Loan Portfolio
Table 3.4 presents the Gross Loan Portfolio (GLP) by delivery mode, collection mode and co-origination. The JLG model continues to account for the largest share; however, individual lending is gaining importance. This shift is supported by improvements in credit assessment, regulatory developments and the evolving requirements of mature borrowers seeking larger loan sizes, greater flexibility and an improved customer experience.
Table 3.4: Composition of Loan Portfolio under Delivery Model, Collection Mode, and Others
| % of Gross Loan Portfolio (GLP) under various modes | |||||||
|---|---|---|---|---|---|---|---|
| Delivery Modes | Collection Modes | Others | |||||
| GLP under JLG lending model | GLP under SHG lending model | GLP under Individual lending model | GLP under Grameen model | GLP under Weekly collection | GLP under Fortnightly collection | GLP under Monthly collection | GLP created under a Co-origination arrangement |
| 77% | 14% | 9% | 0.01% | 17% | 13% | 70% | 1% |
3.4.6 Loan Portfolio of Commercial Banks, SFBs, and Urban Cooperative Bank
Small Finance Banks (SFBs) were established in 2015-16 by the Reserve Bank of India (RBI) to extend banking services to underserved and financially excluded segments. In these Small Finance Banks, the microfinance portfolio continued to be a significant component, at varying levels. There have also been efforts in these institutions to increase the security-linked assets, and as a result, the proportion of the microfinance portfolio has come down significantly. Some of the banks, especially the private sector banks, had microfinance portfolios built through BC mode and even had a network of lending channels. These banks also contributed to supporting the MLIs by supporting liquidity needs through bulk funding (term loans) and strategic partnerships like BC and co-lending arrangements.
As of March 31, 2026, the loan outstanding of 8 SFBs, 5 Commercial Banks, and 1 Urban Cooperative Bank whose data is provided to Sa-Dhan cumulatively stood at ₹65,463 Cr.
As of March 31, 2026, self-reported data from 8 Small Finance Banks (SFBs), 5 Commercial Banks, and 1 Urban Cooperative Bank—operating across 11,612 branches and serving approximately 172 lakh clients- reflects a combined microfinance loan portfolio of ₹65,463 Cr. This, along with the data reported by 178 Micro Lending Institutions (MLIs), 8 SFBs, 5 Commercial Banks, and 1 Urban Cooperative Bank, formed a combined microfinance portfolio of ₹3,09,438 Cr.
The variance between the self-reported microfinance portfolio and credit-bureau data is approximately ₹24,469 Cr, which is due to the fact that the self-reported data was not received from all the operating Commercial Banks, SFBs, and MLIs within the microfinance sector. But the data of the major lending institutions have been captured in this report.