


Chapter 4 - Section 4.1 - SubSection 4.1.2Staff Productivity
Staff productivity remains an important measure of the operational efficiency, cost-effectiveness and service delivery capacity of microfinance institutions. Given the sector’s field-intensive operating model, institutions must effectively manage their workforce while maintaining meaningful engagement with borrowers to support both portfolio quality and institutional sustainability. Productivity is particularly relevant in the current environment, where lenders are increasingly balancing responsible lending, tighter credit assessment, portfolio monitoring and cost optimisation with the need to maintain last-mile outreach. It is also a useful lens on the sector’s contribution to national financial inclusion goals: the RBI’s Financial Inclusion Index rose to 70.0 in March 2026, with the Usage sub-index driving most of the gain, and how efficiently MLI staff can serve borrowers has a direct bearing on how quickly that usage gap continues to close.


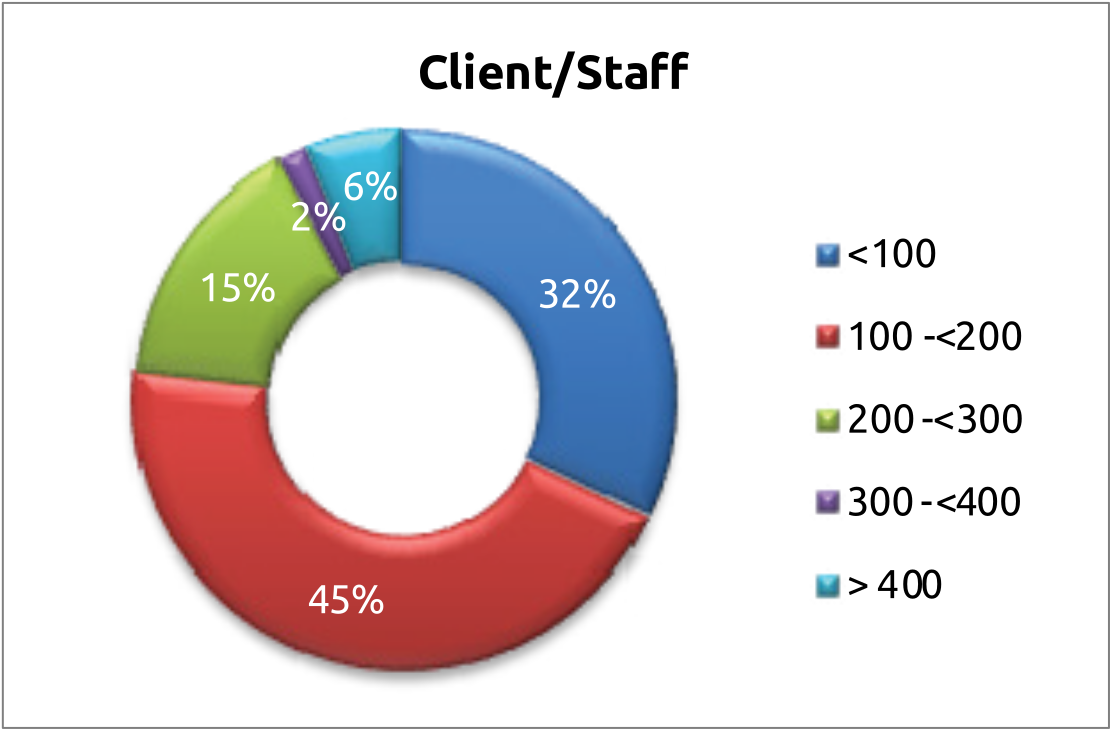
Distribution of MLIs based on clients served per Staff
Distribution of MLIs based on clients served per Credit Officer
4.1.2 Staff Productivity
Staff productivity remains an important measure of the operational efficiency, cost-effectiveness and service delivery capacity of microfinance institutions. Given the sector’s field-intensive operating model, institutions must effectively manage their workforce while maintaining meaningful engagement with borrowers to support both portfolio quality and institutional sustainability. Productivity is particularly relevant in the current environment, where lenders are increasingly balancing responsible lending, tighter credit assessment, portfolio monitoring and cost optimisation with the need to maintain last-mile outreach. It is also a useful lens on the sector’s contribution to national financial inclusion goals: the RBI’s Financial Inclusion Index rose to 70.0 in March 2026, with the Usage sub-index driving most of the gain, and how efficiently MLI staff can serve borrowers has a direct bearing on how quickly that usage gap continues to close.
The borrower-to-staff and borrower-to-credit officer ratios provide useful indicators of how institutions deploy their workforce. A higher ratio may indicate greater workforce efficiency and economies of scale, but if it becomes excessive, it can place pressure on credit assessment, borrower interaction, collection practices and customer service. Conversely, a lower ratio may imply greater staff intensity and closer borrower engagement, although it may also raise operating costs. Striking an appropriate balance between productivity and service quality is therefore essential — and carries implications well beyond any single institution’s cost structure, since it shapes the quality and depth of financial inclusion for millions of low-income borrowers.
For client-to-staff ratios, 32% of institutions report fewer than 100 clients per staff member, while the largest group, 45%, falls in the 100–200 client range. A further 15% have between 200 and 300 clients per staff member. In all, 92% of institutions have fewer than 300 clients per staff member, suggesting that most institutions maintain a reasonably intensive staff structure for customer servicing, field operations,portfolio monitoring and collection efforts. Only a small proportion operate with higher workloads: 2% report 300–400 clients and 6% more than 400 clients per staff member. These higher ratios may reflect greater branch-level efficiency, larger operational scale, or increased use of digital and technology-enabled processes.
Figure 4.1.4 Distribution of MLIs based on clients served per Staff and Credit Officer
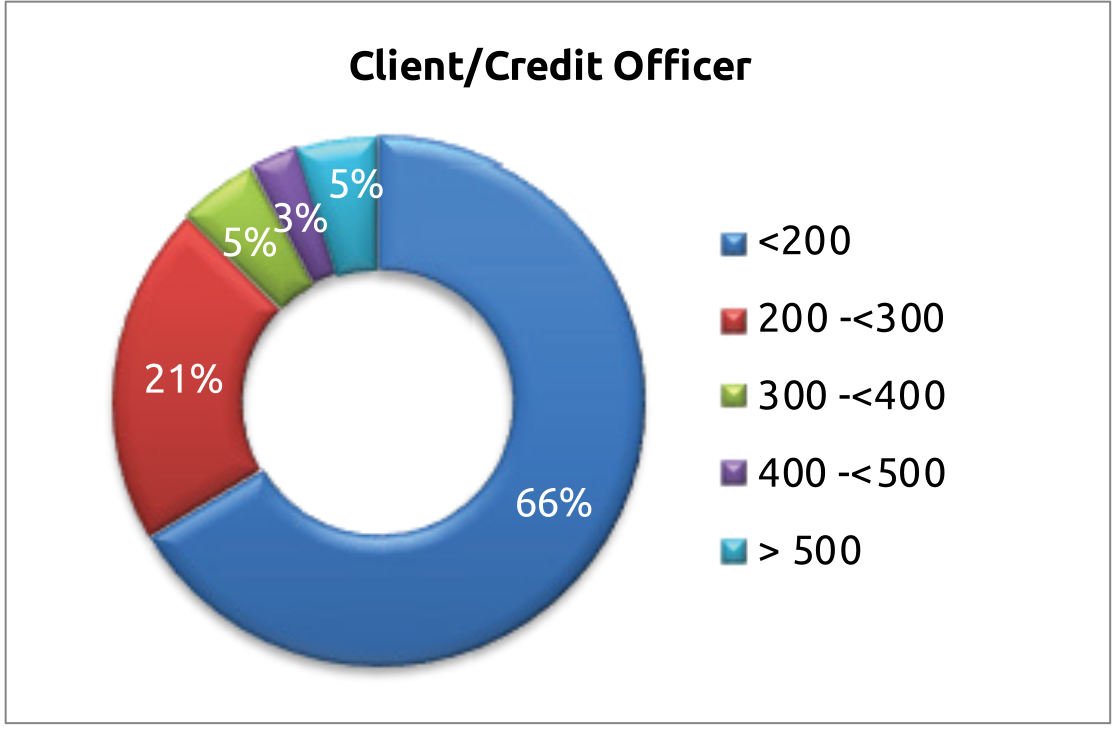
The borrower-to-credit officer ratio is comparatively higher, with 66% of institutions having fewer than 200 clients per credit officer and another 21% in the 200–300 range. As a result, 87% of institutions have fewer than 300 clients per credit officer. However, 5% report 300–400 clients, 3% between 400 and 500, and 5% more than 500 clients per credit officer. This suggests that while frontline credit functions remain relatively well staffed across most institutions, a small segment is operating with significantly higher workloads that merit closer monitoring for borrower protection.
Overall, the ratios indicate a predominantly field-intensive operating model, with institutions maintaining substantial staff engagement relative to their client base. At the same time, higher client loads at some institutions point to operational efficiencies and increasing digitalisation, particularly among larger institutions. Maintaining an appropriate balance will remain important as lenders seek to improve productivity while ensuring quality customer engagement, responsible lending, effective collections and borrower protection.
Figure 4.1.5: Trends of ABCO Across MLIs and break-up of 2026 in terms of Legal Form and Size
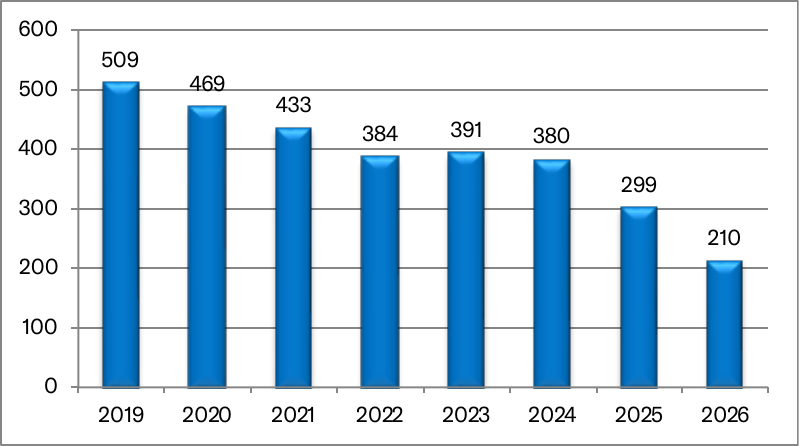
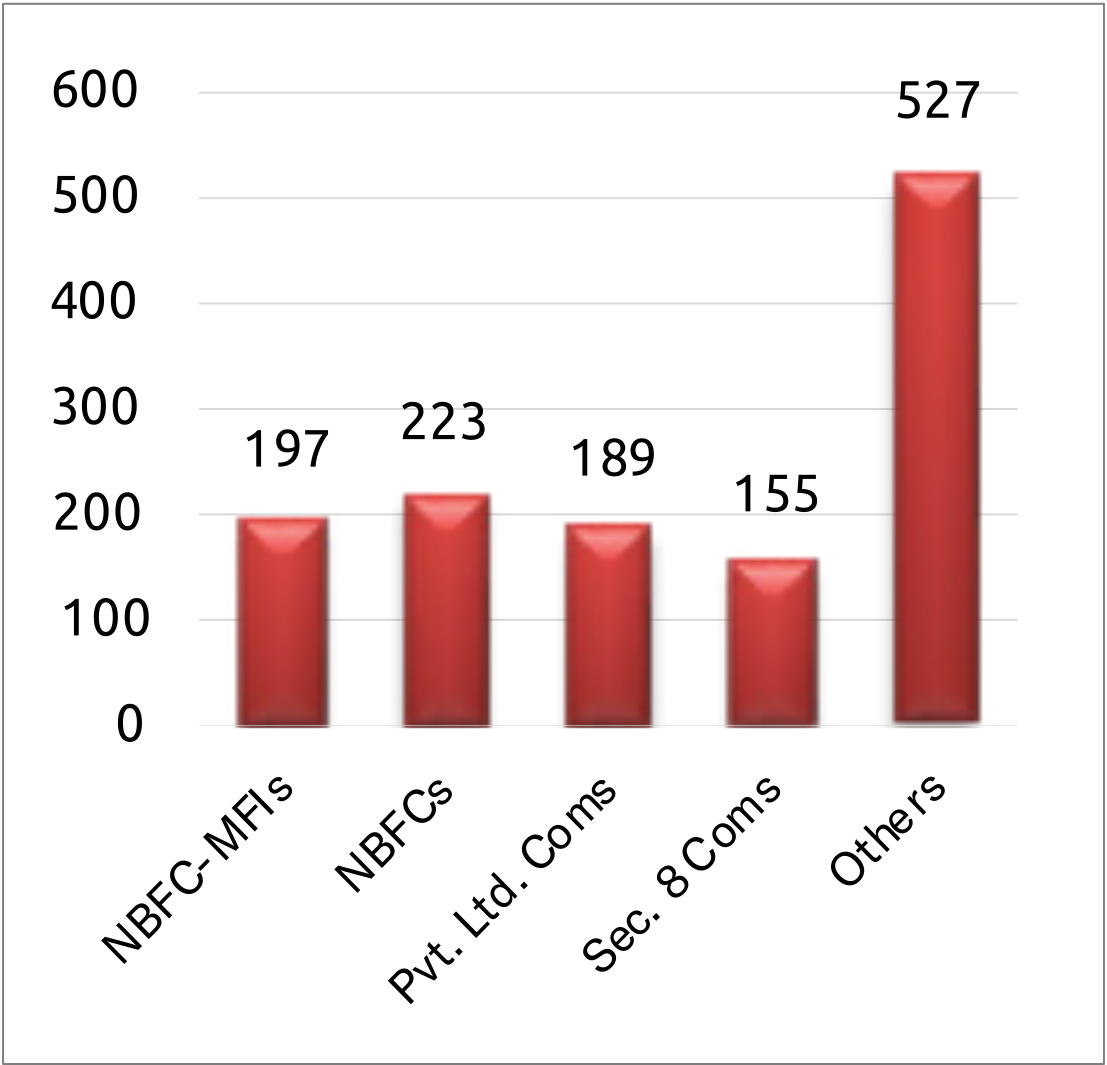
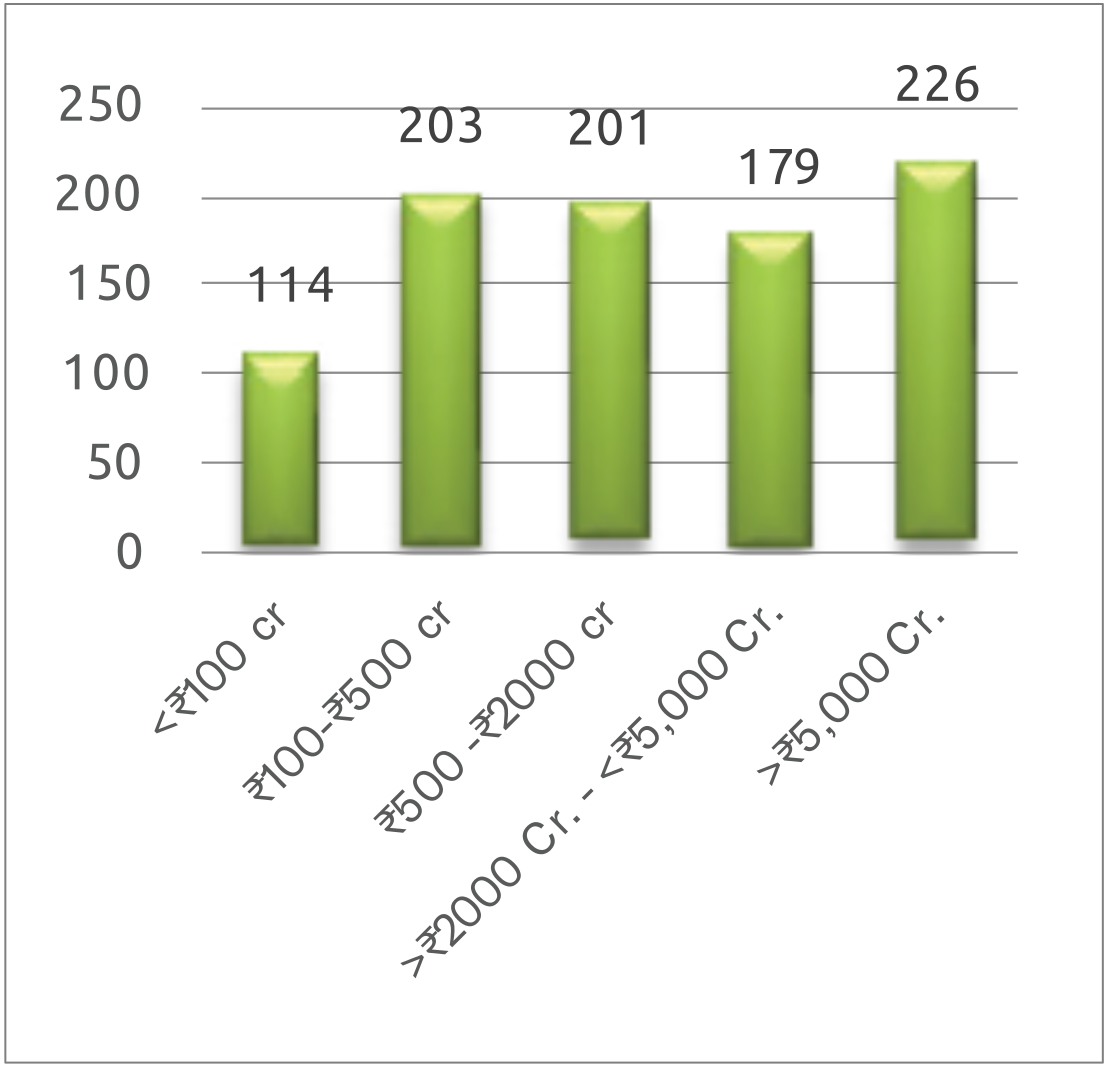
The chart shows a clear and sustained shift in staff productivity, measured by the number of clients served per credit officer, over 2019–2026. The ratio declined from 509 clients per credit officer in 2019 to 384 in 2022, before a brief uptick to 391 in 2023. It then fell further to 380 in 2024, 299 in 2025 and 210 in 2026. The steepest decline came in the last two years, with the ratio falling by nearly 21% in 2025 and 30% in 2026, leaving the 2026 level at less than half of the 2019 figure. This can be also attributed to weakening of group concept with more and more individualized lending happening in microfinance sector.
Figure 4.1.6: Trends of ABS Across MLIs and break-up of 2026 in terms of Legal Form and Size
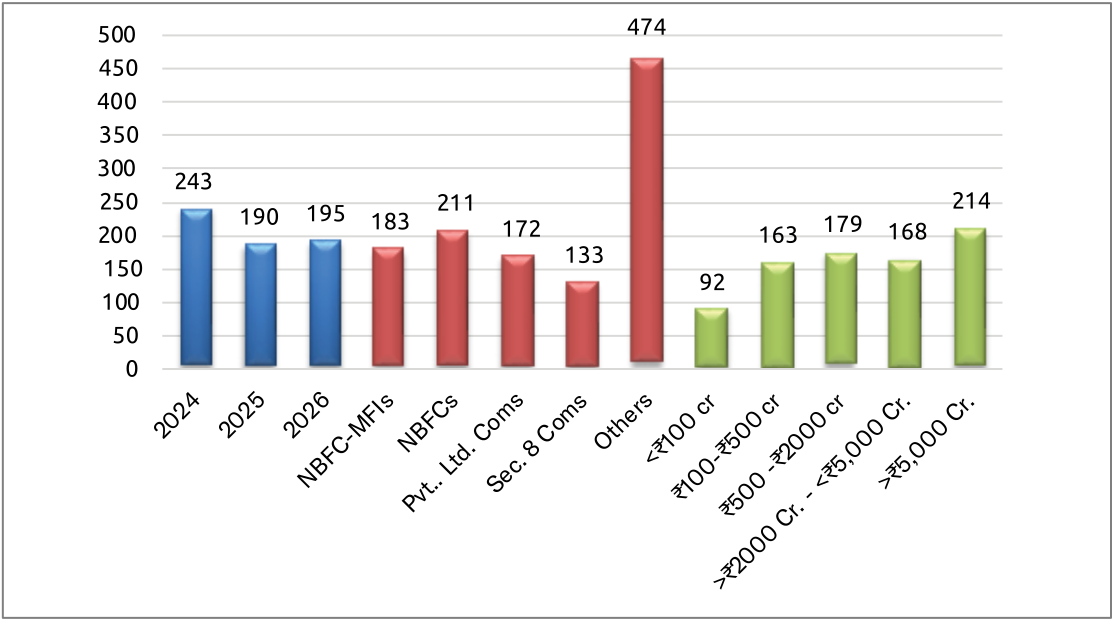
This trend suggests institutions are deploying more staff per client than at any point in the last several years — a pattern consistent with greater emphasis on responsible lending, closer borrower engagement, credit assessment, collections and portfolio monitoring.