


Chapter 3Mapping Microfinance Expansion Across India
Chapter 2 presents sector-level data and analysis based on the secondary data sourced from Equifax India. In contrast, Chapter 3 draws on information collected directly from the member and non-member MLIs. Accordingly, this chapter provides detailed insights into the operational profile, performance, and functioning of MLIs in India.


Mapping Microfinance Expansion Across India
Chapter 2 presents sector-level data and analysis based on the secondary data sourced from Equifax India. In contrast, Chapter 3 draws on information collected directly from the member and non-member MLIs. Accordingly, this chapter provides detailed insights into the operational profile, performance, and functioning of MLIs in India.
The analysis in this chapter is based on the data reported by 178 Micro Lending Institutions (MLIs) operating across India. The reporting MLIs comprises of NBFC-MFIs, NBFCs, Sec. 8 Coms, Societies, Trusts, MACS or Cooperatives, and Pvt. Ltd. Coms. The Commercial Banks, Small Finance Banks (SFBs), and Urban Cooperative Bank operating in the microfinance segment are excluded from the scope of this chapter, except where explicitly stated. The analysis herein focuses exclusively on Micro Lending Institutions (MLIs)—including NBFC-MFIs, NBFCs, Societies, Trusts, Section 8 Companies, and other entities operating as MFIs or Business Correspondent (BC) agents.
During FY 2025-26, the microfinance sector navigated through a challenging macroeconomic environment and regulatory headwinds. Rising credit costs, moderated credit growth, and tighter borrower exposure limits collectively constrained client acquisition. Consequently, Micro Lending Institutions (MLIs) experienced a slowdown in disbursements, putting pressure on sectoral growth, profitability, and overall operational resilience.
In response, MLIs adopted more cautious approaches to give loans, guided by the RBI regulations and guardrails promoted by the Self-Regulatory Organisations (SROs). The year also witnessed increased interest in adoption of technology, including artificial intelligence, to improve operating efficiency, strengthen decision-making and enhance monitoring. Notwithstanding these developments, the operating environment remained demanding for a significant part of the sector.
3.1 Geographical Spread of Microfinance
Analysis of the dataset comprising 178 Micro Lending Institutions (MLIs), representing over 98% of the sector’s total MLIs portfolio1, indicates widespread national presence across 28 states, 5 Union Territories, and 686 districts2 in India. While geographic reach is extensive, market penetration remains heavily concentrated within the top 200 to 250 districts. Minor variance exists between these findings and the coverage metrics in Chapter 2, which draw on Credit Information Company (CIC) data reporting activity across 35 States/UTs and nearly 780 districts. This divergence is attributable to underlying methodological differences in reporting mechanisms rather than operational contraction, reinforcing the sector’s robust national footprint.
Table 3.1: No. of MLIs operating in the States/UTs and districts as of March 2026 (in alphabetical order)
| Sl. No. | Name of the State/UT | No. of MLIs operating in the State/UT (including those having Headquarters outside) | No. of districts of the state where MLIs operate |
|---|---|---|---|
| 1 | Andaman & Nicobar Islands | 2 | 1 |
| 2 | Andhra Pradesh | 29 | 25 |
| 3 | Arunachal Pradesh | 6 | 7 |
| 4 | Assam | 31 | 34 |
| 5 | Bihar | 64 | 38 |
| 6 | Chandigarh | 3 | 1 |
| 7 | Chhattisgarh | 35 | 32 |
| 8 | Delhi | 8 | 5 |
| 9 | Goa | 12 | 2 |
| 10 | Gujarat | 34 | 32 |
| 11 | Haryana | 37 | 22 |
| 12 | Himachal Pradesh | 13 | 10 |
| 13 | Jammu & Kashmir | 5 | 4 |
| 14 | Jharkhand | 46 | 24 |
| 15 | Karnataka | 44 | 31 |
| 16 | Keralam | 38 | 14 |
| 17 | Madhya Pradesh | 50 | 55 |
| 18 | Maharashtra | 50 | 36 |
| 19 | Manipur | 10 | 12 |
| 20 | Meghalaya | 8 | 6 |
| 21 | Mizoram | 5 | 4 |
| 22 | Nagaland | 3 | 3 |
| 23 | Odisha | 42 | 30 |
| 24 | Puducherry | 27 | 4 |
| 25 | Punjab | 18 | 23 |
| 26 | Rajasthan | 47 | 41 |
| 27 | Sikkim | 6 | 5 |
| 28 | Tamil Nadu | 68 | 38 |
| 29 | Telangana | 25 | 33 |
| 30 | Tripura | 16 | 8 |
| 31 | Uttar Pradesh | 62 | 75 |
| 32 | Uttarakhand | 28 | 8 |
| 33 | West Bengal | 49 | 23 |
| Total | 686 |
1 Portfolio, GLP, and Loan Outstanding have been used interchangeably throughout this entire report.
2 Some of these districts may not have an active presence of some MLIs at present, as they may have exited. But they have been able to reach these districts at one time or another.
3.2 MLIs Branch Network
Branches remain an important component of the MLI operating model. They support customer acquisition, sourcing of loan applications, credit appraisal, disbursement processes, portfolio monitoring, grievance management, and collections. Consequently, branch productivity, governance and service quality have a direct bearing on the operational effectiveness and portfolio outcomes.
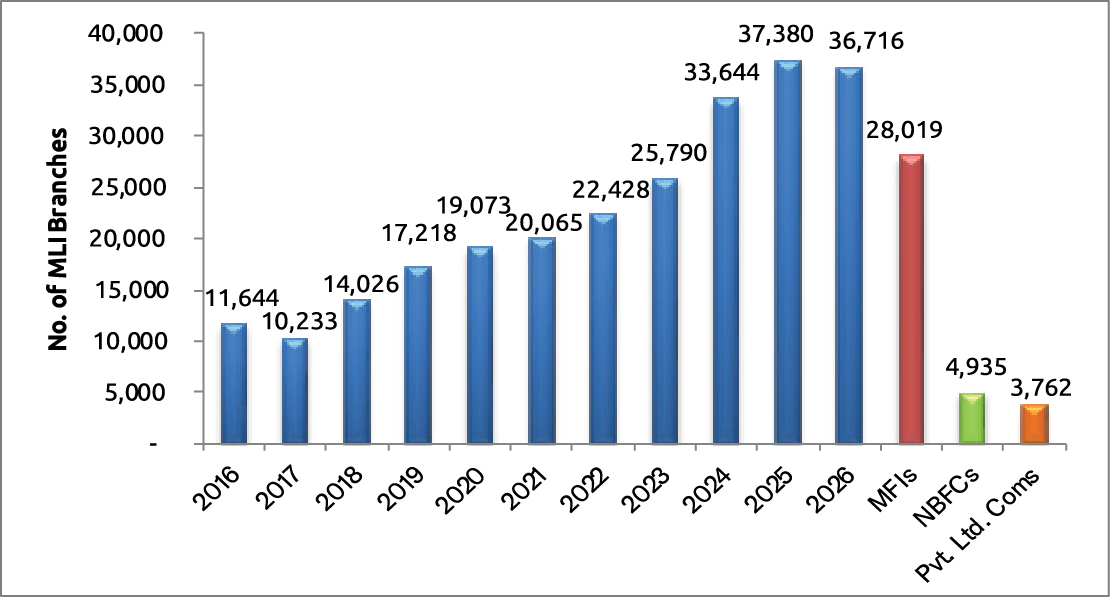
As of March 31, 2026, MLIs operated 36,716 branches across the country, compared with 37,380 branches in the previous year, representing a year-on-year decline of 2%. Considering only the Microfinance Institutions (MFI) category—comprising NBFC-MFIs, Societies, Sec. 8 Coms, Trusts, MACS or Cooperatives—and excluding NBFCs and Pvt. Ltd. Coms, the year-on-year decline in the branch network is also 2%. The decline in branches in the microfinance sector is driven by factors such as overall contraction in portfolio and borrower outreach, cost optimisation, adoption of technology-enabled processes, cautious credit expansion, and institutional exits or consolidation.
As of March 31, 2026, the MFIs operated 28,019 branches, NBFCs engaged in microfinance operated 4,935 branches, and Pvt. Ltd. Coms functioning as BC agents operated 3,762 branches. By legal form, NBFC-MFIs accounted for the largest share, with 27,167 branches (74%). By institutional size, Very Large MLIs (GLP > ₹5,000 Cr.) accounted for 18,998 branches (52%) of the total branch network.
Figure 3.1: MLI Branch Network – Yearly Trend and Category-wise Breakup
A further segregation of the total branch network based on the legal forms of MLIs and the size of MLIs is given below:
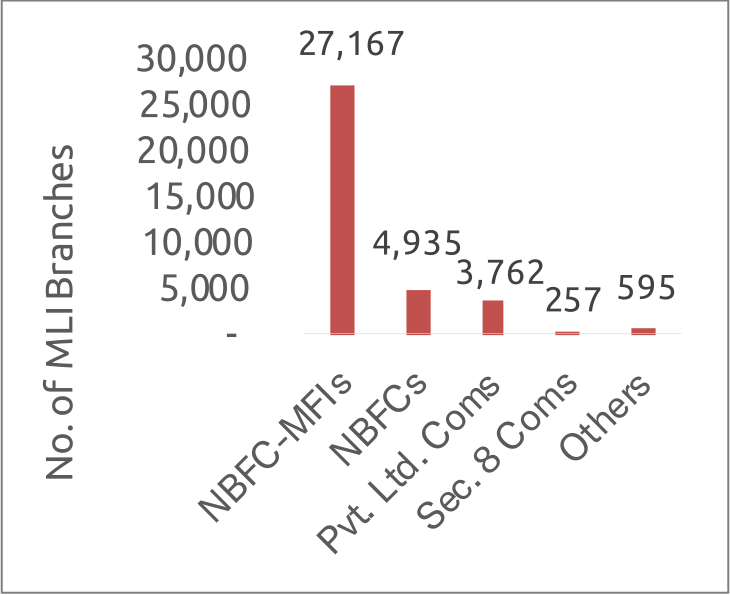
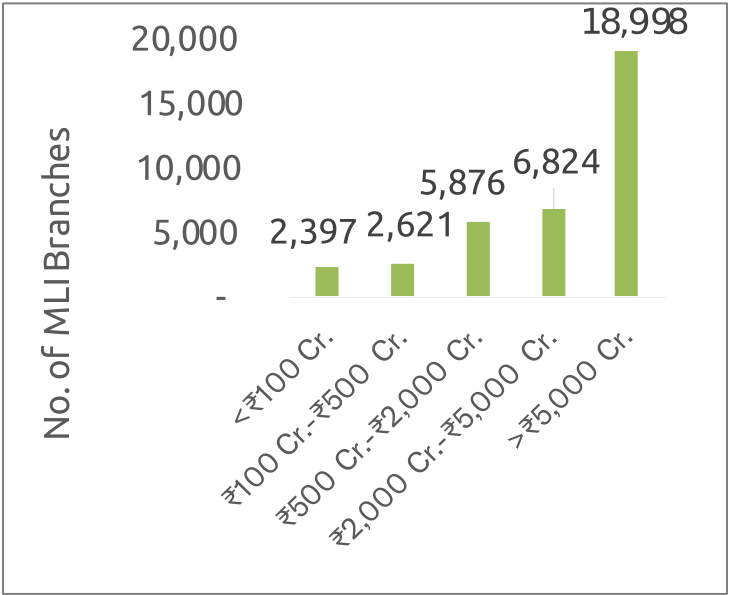
Note: In the decadal trend graph of the branch network (2016–2026) shown above, the number of branches for each year is represented by blue bars, capturing all Micro Lending Institutions (MLIs). For FY 2025-26, however, the total branch network of 36,716 has been further segmented to provide deeper insights. Specifically, the distribution highlights MFIs (NBFC-MFIs, Societies, Sec. 8 Coms, Trusts, MACS, or Cooperatives) shown by red bars, NBFCs shown by green bars, and Pvt. Ltd. Coms working as BC agents shown by orange bars. This disaggregation enables a clearer understanding of the growth trajectory of MFIs within the overall branch network.
3.3 Client3 Outreach of MLIs
Microfinance serves the financial needs of low-income households that may face constraints in accessing formal credit from mainstream banking channels. MLIs provide loans to these households using delivery models designed to improve accessibility and convenience.
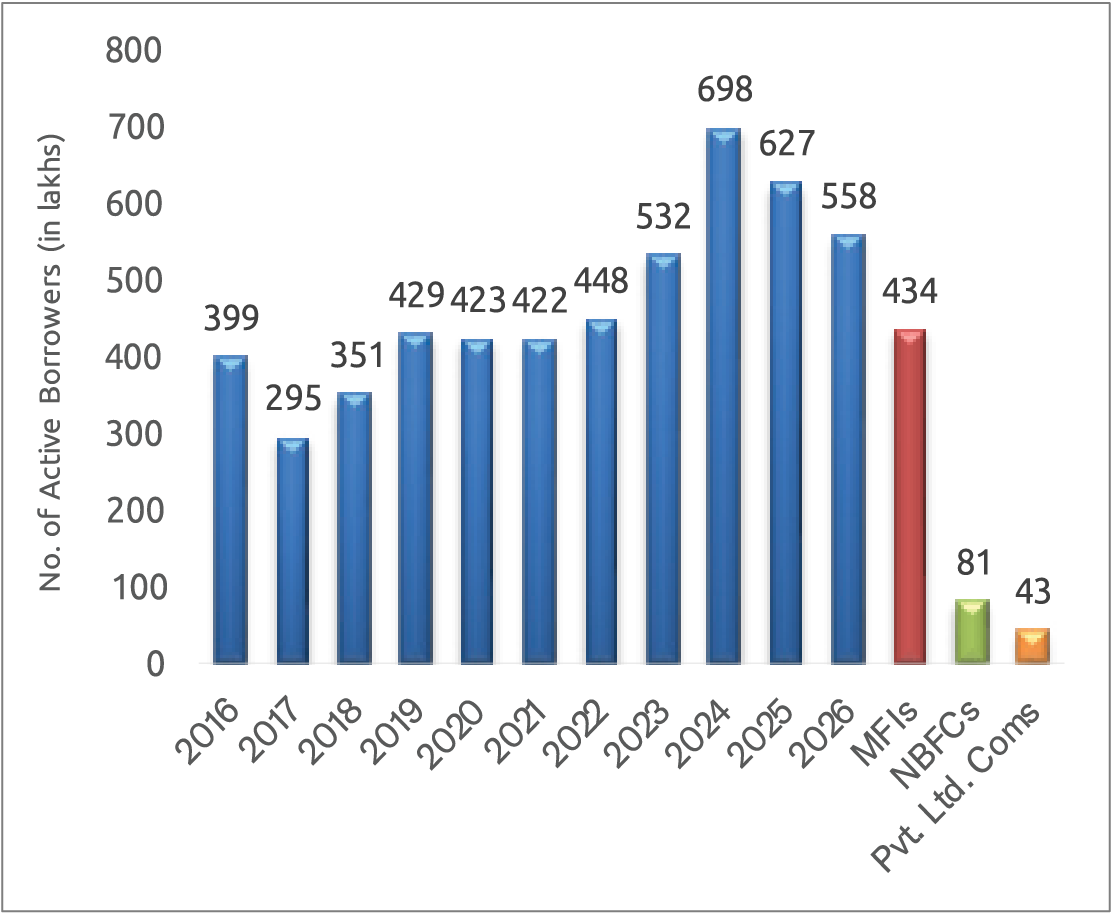
The active client base of MLIs declined to 558 lakhs in FY 2025-26 from 627 lakhs in the previous year, representing a year-on-year decline of 11%. Excluding the client base of NBFCs and BC Companies, the Microfinance Institutions (MFI) category—comprising NBFC-MFIs, Societies, Sec.8 Coms, Trusts, MACS or Cooperatives—reported an active client base of 434 lakhs, with a year-on-year decline of 14%.
The NBFC-MFIs serve the largest share of microfinance clients, accounting for 70% of the total active clients. NBFCs account for a further 14%, while Societies, Trusts, MACS or Cooperatives and Pvt. Ltd. Coms collectively serve nearly 16% of active clients. Sec. 8 Companies account for a marginal share of 0.3%. From a size perspective, Very Large MLIs (GLP > ₹5,000 Cr.) collectively account for nearly 68% of the active client base reported by the 178 MLIs.
3 Clients of MLIs are essentially Loan Borrowers. ‘Clients’ and ‘Borrowers’ have been used interchangeably throughout this entire report.
Figure 3.2: Outreach of MLIs to Active Borrowers (in lakhs): Yearly Trend and Category–wise Breakup as of March 2026
A further segregation of the total client outreach based on the legal forms of MLIs and the size of MLIs is given below:
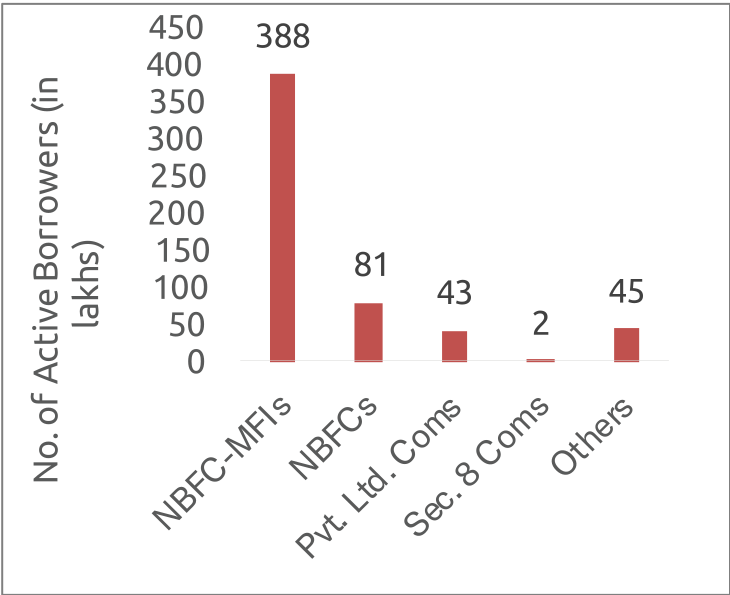
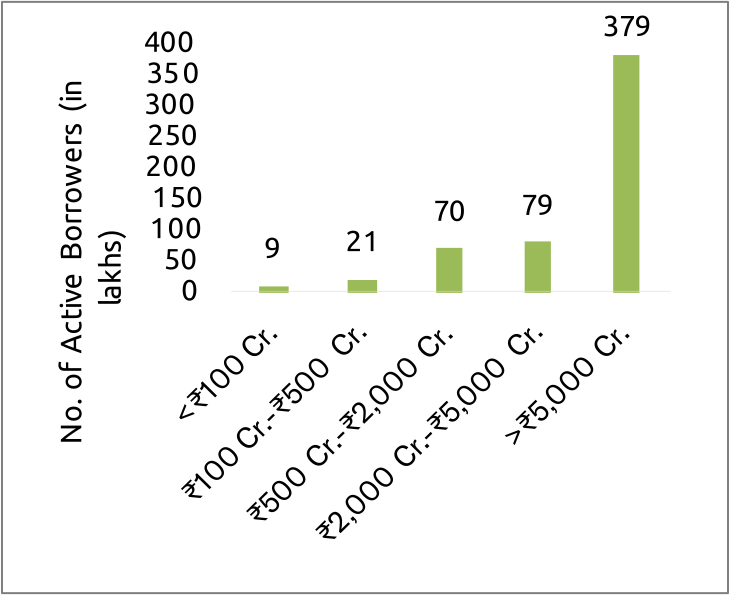
Note: In the decadal trend graph of active borrowers given above, the number of active borrowers in each year (from 2016-2026) represented by blue bars, includes active borrowers of all the Micro Lending Institutions (MLIs), however for FY 2025-26, the break-up of total number of active borrowers (i.e. 558 lakhs) is segregated as MFIs (NBFC-MFIs, Societies, Sec.8 Coms, Trust, MACS or Cooperatives), (represented by red bar), NBFCs (represented by green bar), and Pvt. Ltd. Coms (represented by orange bar) to get a better understanding of the growth of the MFIs.
3.3.1 New Borrowers4
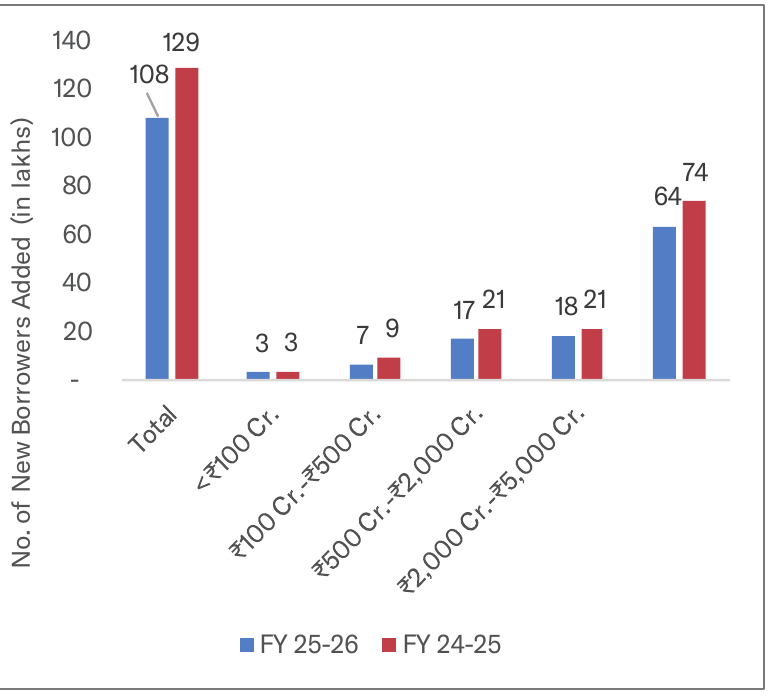
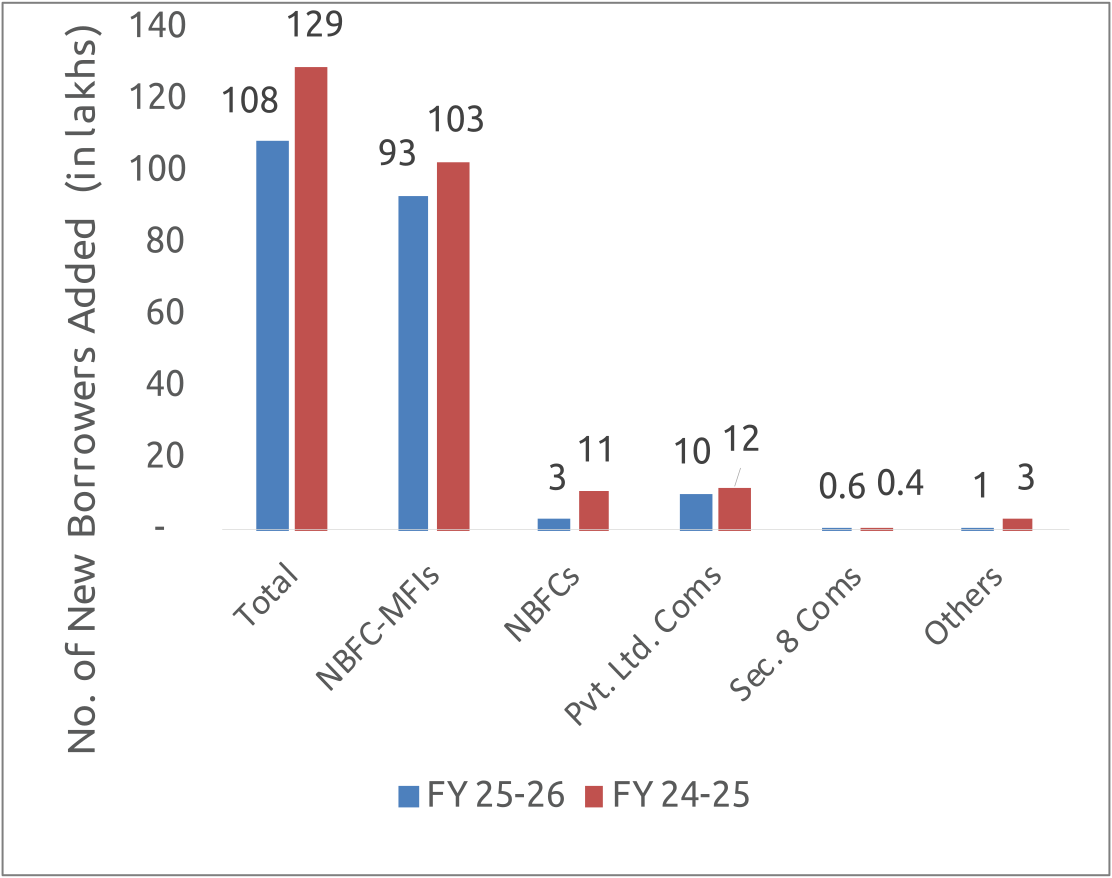
The business expansion of MLIs is primarily driven by the addition of new borrowers. As per reported data, 146 MLIs added nearly 108 lakhs new borrowers during FY 2025-26, compared to 129 lakhs new borrowers added by 158 MLIs in the previous year. NBFC-MFIs had a dominant share, with 93 lakhs accounting for 86% of the total, while Very Large MLIs (with GLP >₹5,000 Cr.) contributed 64 lakhs, representing 59% of the new borrowers added.
4 It is noteworthy that many of the borrowers classified as “new” may not be entirely new to credit, but rather new to the reporting MLI during the financial year.
Figure 3.3: No. of MLI New Borrowers (in lakhs) added and Category–wise Breakup during FY 25-26
3.3.2 Rural–Urban Share of MLI Active Borrowers
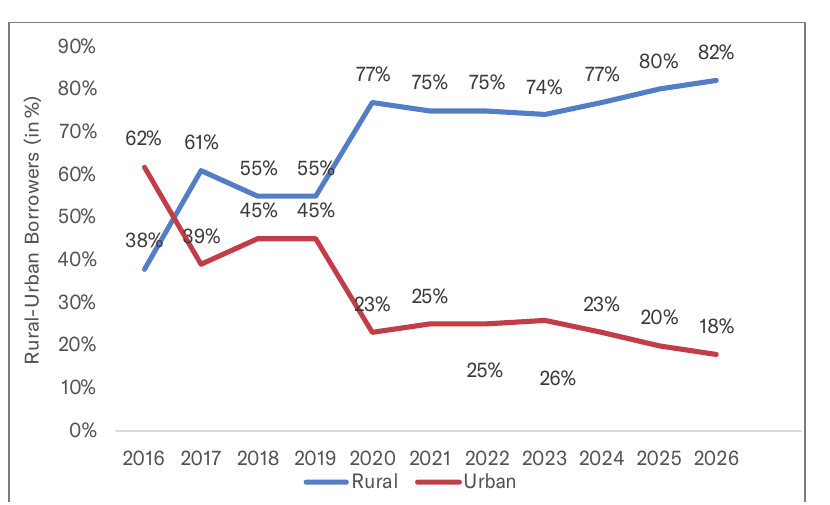
MLIs serve low-income borrowers in both rural and urban markets. The rural–urban composition has changed over time. Urban borrowers represented a larger share in FY 2016, as reflected in Figure 3.4. The subsequent transition of several large, predominantly urban NBFC-MFIs into SFBs altered the composition of the remaining MLI portfolio. The current client base is predominantly rural, consistent with the continuing importance of rural markets in India. The data also shows an increasing share of rural clients from 2023 onwards. Smaller MLIs have generally retained a rural focus, although some institutions operate exclusively in urban markets.
Figure 3.4: Trends in Rural-Urban Share of MLI Active Borrowers
3.3.3 Outreach to special segment of Microfinance Active Borrowers
The microfinance sector’s active borrower base reflects strong financial inclusion across priority categories mandated under RBI’s Priority Sector Lending framework. Scheduled Caste/Scheduled Tribe (SC/ST) borrowers constitute 24% of the microfinance active borrowers, while Minority community borrowers (Muslim, Christian, Sikh, Buddhist, Parsis, Jain) represent 16%, and persons with disabilities (differently abled) comprise 1%. Economically, half (50%) of all active borrowers hold Below Poverty Line (BPL) cards, underscoring outreach to the most vulnerable segments. Gender inclusion remains a cornerstone of the portfolio, with women borrowers accounting for 98% of the total active borrower base.
Table 3.2: Composition of Microfinance Active Borrowers- Category-wise
| Composition of Special Segment of Microfinance Active Borrowers | ||||
|---|---|---|---|---|
| Women Borrowers | SC/ST Borrowers | Minority Borrowers | Differently Abled Borrowers | Borrowers having BPL Card |
| 98% | 24% | 16% | 1% | 50% |
3.4 Loan Outstanding
3.4.1 On-Balance Sheet Portfolio of MLIs
The On-Balance Sheet/ On Book portfolio represents loans that Micro Lending Institutions (MLIs) have on their own books, funded through their own capital and borrowings, as against the loans originated and assigned or securitised to other lenders, but managed by the original institution. The portfolio originated through Business Correspondent or co-lending arrangements also forms part of managed assets and does not form part of the on-book, except the portion of share owned by the originator under co-lending arrangement.
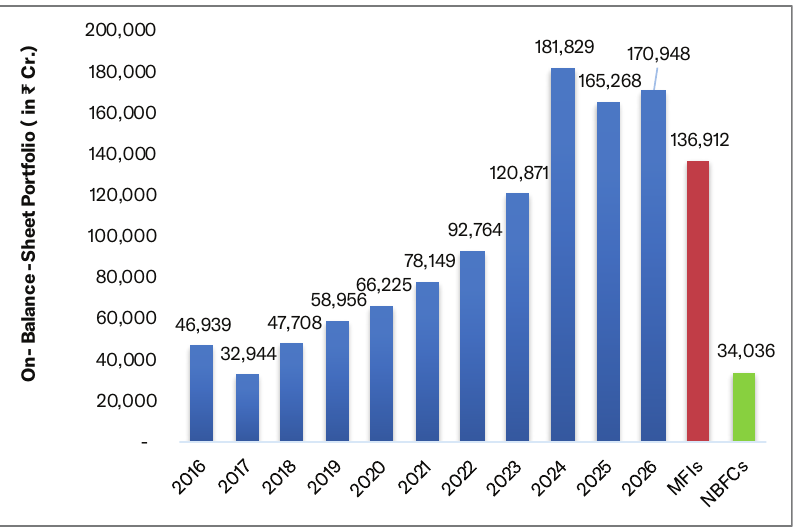
As of March 31, 2026, the On-Balance Sheet Portfolio stood at ₹1,70,948 Cr., making it the dominant share of the sector’s overall lending activity. It has grown by 3% year-on-year from ₹1,65,268 Cr. in March 2025. In the case of Off-Balance Sheet portfolio arrangements, especially with co-lending, borrowers benefit due to lower rates of interest or getting facilities from financial institutions with a local touch and feel.
Figure 3.5: On-Balance-Sheet Loan Portfolio of MLIs (in ₹ Cr.) –Yearly Trend and Category–wise Breakup as of March 2026
A further segregation of the On-Balance-Sheet Loan Portfolio based on the legal forms of MLIs and the size of MLIs is given below:
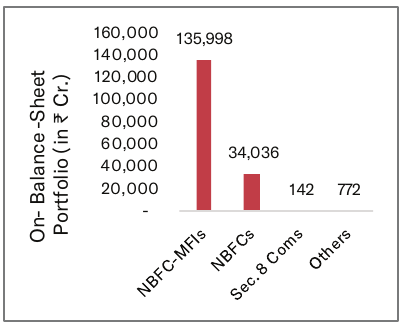
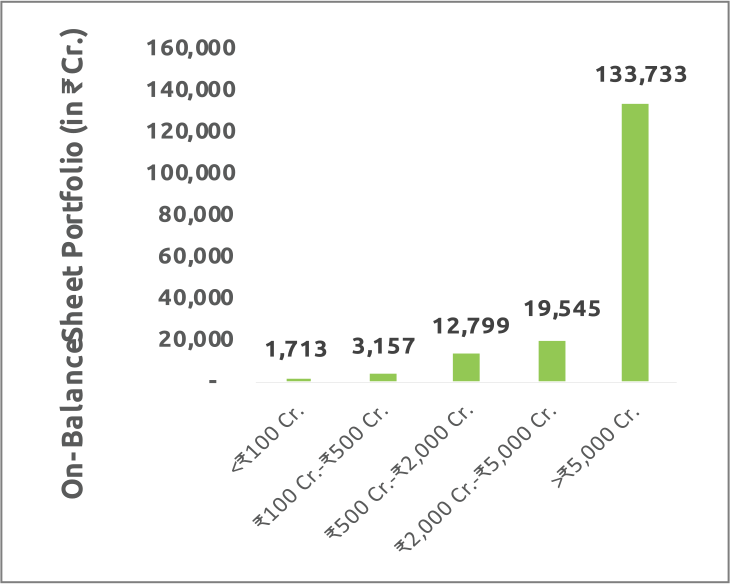
Note: In the decadal trend graph of the On-Balance Sheet Portfolio (2016–2026) shown above, the On-Balance Sheet Portfolio for each year is represented by blue bars, covering all Micro Lending Institutions (MLIs). For FY 2025-26, however, the total On-Balance Sheet Portfolio of ₹1,70,948 Cr. has been further disaggregated to provide clearer insights. The breakdown highlights MFIs (NBFC-MFIs, Societies, Sec. 8 Coms, Trusts, MACS, or Cooperatives) shown in red, NBFCs in green, and Pvt. Ltd. Coms in orange, offering a clearer picture of the growth pattern of MFIs.
3.4.2 Off-Balance Sheet/Managed Loan Portfolio of MLIs
The borrowers typically seek loans for diverse purposes—ranging from loans for emergency and consumption needs to small businesses, working capital, and housing are met through such arrangements. Mainstream lenders often are unable to meet these demands due to the small loan sizes, lack of collateral, and procedural complexities. MLIs have filled this gap, playing a crucial role in serving the financially excluded.
MLIs use securitisation and direct assignment to mobilise resources for portfolio growth. Some institutions also operate as Business Correspondents (BCs), enabling them to originate and service loans on behalf of Banks and Financial Institutions without having to bother for raising funds for their operations and expanding business. It basically provides margin, which adds to their income through fees. These arrangements also support lenders in meeting priority-sector objectives and provide MLIs with an income stream, while helping address funding and capital constraints. Although MLIs manage the portfolios operationally, the assets do not sit on their books, and they report them as Off-Balance-Sheet portfolios.
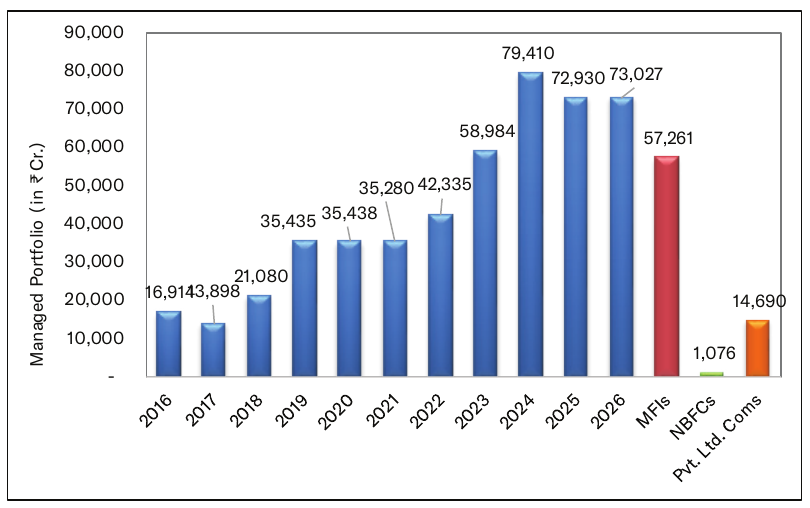
As of March 31, 2026, 99 MLIs reported a Managed Portfolio of ₹73,027 Cr., which are classified as Off-Balance-Sheet portfolio, compared with ₹72,930 Cr. at the end of FY 2024-25. The Managed Portfolio has grown by a meagre 0.1% during FY 2025-26. Figure 3.6 presents the category-wise distribution of this portfolio.
Figure 3.6: Managed/Off-Balance-Sheet Loan Portfolio of MLIs (in ₹ Cr.) –Yearly Trend and Category–wise Breakup as of March 2026
A further segregation of the Managed Loan Portfolio based on the legal forms of MLIs and the size of MLIs is given below:
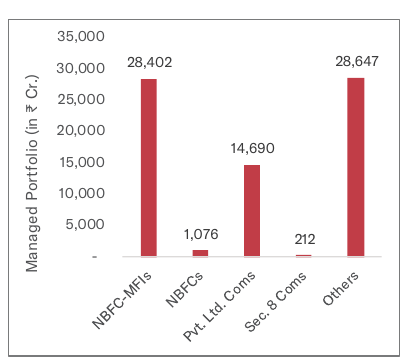
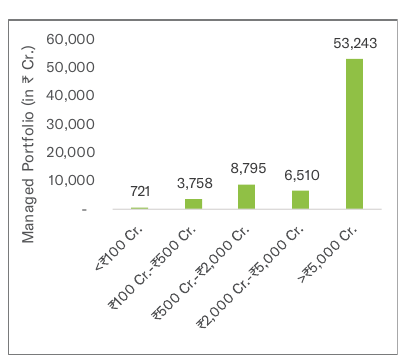
Note: In the decadal trend graph of the Managed Portfolio (2016–2026) shown above, the Managed Portfolio for each year is represented by blue bars, covering all Micro Lending Institutions (MLIs). For FY 2025-26, however, the total Managed Portfolio of ₹73,027 Cr. has been further disaggregated to provide clearer insights. The breakdown highlights MFIs (NBFC-MFIs, Societies, Sec. 8 Coms, Trusts, MACS, or Cooperatives) shown in red, NBFCs in green, and Pvt. Ltd. Coms in orange, offering a clearer picture of the growth pattern of MFIs.
3.4.3 Business Correspondent (BC) Portfolio of MLIs
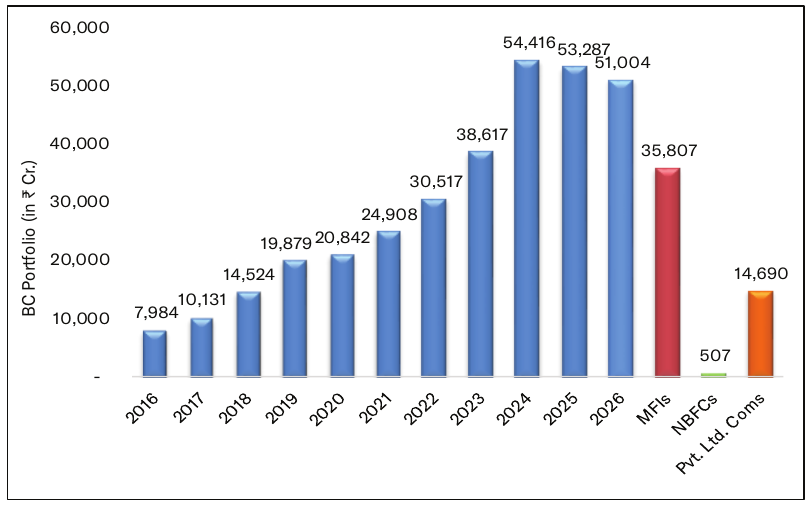
Business Correspondents (BCs) appointed by Banks and Financial Institutions help in sourcing clients, managing the accounts, and servicing the collections on their behalf. Initially, only NGO-MFIs were permitted to function as BCs. The RBI later extended this facility to incorporated entities also, thereby allowing NBFC-MFIs to act as BC. Consequently, an increasing number of MLIs, particularly smaller ones facing challenges in raising capital, have adopted the BC model to expand their business and generate income. As of March 31, 2026, 84 MLIs are functioning as BC agents, with the total loan portfolio under the BC model standing at ₹51,004 Cr., registering a decline of (-4%) in FY 2025-26. The BC portfolio accounts for nearly 70% of the Managed Portfolio.
The distribution of the BC portfolio among different categories of MLIs is displayed in Figure 3.7:
Figure 3.7: BC Loan Portfolio of MLIs (in ₹ Cr.) and Category–wise Breakup as of March 2026
A further segregation of the Business Correspondent Loan Portfolio based on the legal forms of MLIs and the size of MLIs is given below:
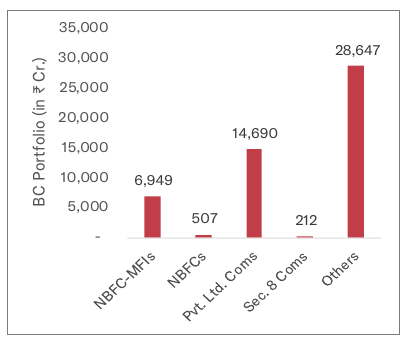
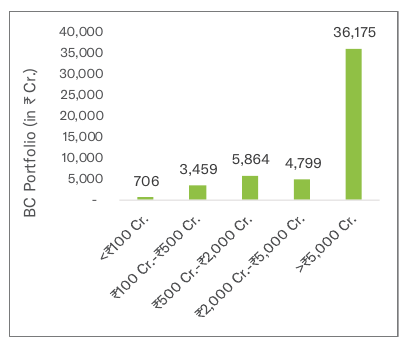
Note: In the decadal trend graph of the BC Portfolio (2016–2026) shown above, the BC Loan Portfolio for each year is represented by blue bars, covering all Micro Lending Institutions (MLIs). For FY 2025-26, the total BC Portfolio of ₹51,004 Cr. has been further disaggregated to provide deeper insights. The breakdown shows MFIs (NBFC-MFIs, Societies, Sec. 8 Coms, Trusts, MACS, or Cooperatives) in red, NBFCs in green, and Pvt. Ltd. Coms in orange, offering a clearer view of the growth trend of MFIs.
3.4.4 Qualified and Non-Qualified Loan Portfolio:
Table 3.3: Qualified and Non-Qualified Portfolio
| On-Balance-Sheet Portfolio (in ₹ Cr.) | Off-Balance Sheet Portfolio (in ₹ Cr.) | ||
|---|---|---|---|
| ₹1,70,948 Cr. (70%) | ₹73,027 Cr. (30%) | ||
| Qualified Loan Portfolio and % share within On-Balance-Sheet Portfolio | Non-Qualified Loan Portfolio and % share within On-Balance-Sheet Portfolio | Qualified Loan Portfolio and % share within Off-Balance-Sheet Portfolio | Non-Qualified Loan Portfolio and % share within Off-Balance-Sheet Portfolio |
| ₹1,47,099 Cr. | ₹23,849 Cr. | ₹63,420 Cr. | ₹9,606 Cr. |
| 86% | 14% | 87% | 13% |
Out of the total portfolio of reported MLIs, the On-Balance Sheet Portfolio comprised ₹1,70,948 Cr. (70%), and the Off-Balance Sheet Portfolio comprised ₹73,027 Cr. (30%), indicating that more than two-thirds of the portfolio continues to be held on the books of lending institutions. Within the On-Balance-Sheet portfolio, qualified assets accounted for ₹1,47,099 Cr. (86%), while non-qualified assets stood at ₹23,849 Cr. (14%). Similarly, the Off-Balance Sheet Portfolio exhibited a comparable composition, with qualified assets amounting to ₹63,420 Cr. (87%) and non-qualified assets at ₹9,606 Cr. (13%). The consistently high share of qualified assets across both portfolio categories reflects strong alignment with the applicable qualifying asset norms and prudent portfolio management practices among reporting institutions.
3.4.5 Segments of MLIs’ Loan Portfolio
Table 3.4 presents the Gross Loan Portfolio (GLP) by delivery mode, collection mode and co-origination. The JLG model continues to account for the largest share; however, individual lending is gaining importance. This shift is supported by improvements in credit assessment, regulatory developments and the evolving requirements of mature borrowers seeking larger loan sizes, greater flexibility and an improved customer experience.
Table 3.4: Composition of Loan Portfolio under Delivery Model, Collection Mode, and Others
| % of Gross Loan Portfolio (GLP) under various modes | |||||||
|---|---|---|---|---|---|---|---|
| Delivery Modes | Collection Modes | Others | |||||
| GLP under JLG lending model | GLP under SHG lending model | GLP under Individual lending model | GLP under Grameen model | GLP under Weekly collection | GLP under Fortnightly collection | GLP under Monthly collection | GLP created under a Co-origination arrangement |
| 77% | 14% | 9% | 0.01% | 17% | 13% | 70% | 1% |
3.4.6 Loan Portfolio of Commercial Banks, SFBs, and Urban Cooperative Bank
Small Finance Banks (SFBs) were established in 2015-16 by the Reserve Bank of India (RBI) to extend banking services to underserved and financially excluded segments. In these Small Finance Banks, the microfinance portfolio continued to be a significant component, at varying levels. There have also been efforts in these institutions to increase the security-linked assets, and as a result, the proportion of the microfinance portfolio has come down significantly. Some of the banks, especially the private sector banks, had microfinance portfolios built through BC mode and even had a network of lending channels. These banks also contributed to supporting the MLIs by supporting liquidity needs through bulk funding (term loans) and strategic partnerships like BC and co-lending arrangements.
As of March 31, 2026, the loan outstanding of 8 SFBs, 5 Commercial Banks, and 1 Urban Cooperative Bank whose data is provided to Sa-Dhan cumulatively stood at ₹65,463 Cr.
As of March 31, 2026, self-reported data from 8 Small Finance Banks (SFBs), 5 Commercial Banks, and 1 Urban Cooperative Bank—operating across 11,612 branches and serving approximately 172 lakh clients- reflects a combined microfinance loan portfolio of ₹65,463 Cr. This, along with the data reported by 178 Micro Lending Institutions (MLIs), 8 SFBs, 5 Commercial Banks, and 1 Urban Cooperative Bank, formed a combined microfinance portfolio of ₹3,09,438 Cr.
The variance between the self-reported microfinance portfolio and credit-bureau data is approximately ₹24,469 Cr, which is due to the fact that the self-reported data was not received from all the operating Commercial Banks, SFBs, and MLIs within the microfinance sector. But the data of the major lending institutions have been captured in this report.
3.5 Distribution of Loans by Purpose
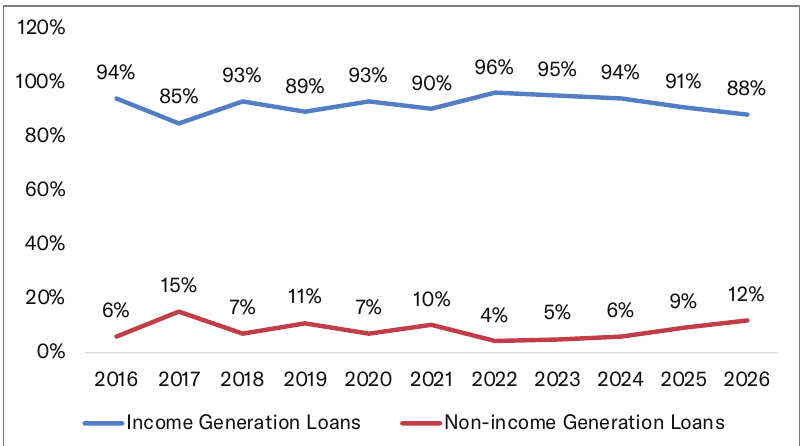
Under the current regulatory framework, RBI has not prescribed any proportion for income-generating and non-income-generating lending. MLIs have, however, broadly retained the lending pattern followed earlier.
Self-reported data indicate that borrowers use loans for a range of purposes. A majority of lending is directed towards income-generating activities such as agriculture, animal husbandry, trading and agro-enterprises. Loans are also used for non-income-generating purposes, including consumption, housing, education, water and sanitation, and health.
Figure 3.8 presents the distribution of lending between income-generating and non-income-generating purposes. Within income generating segment, Agriculture accounts for the largest share at 41%, followed by animal husbandry (18%), and trading (14%). Within the non-income-generating segment, the principal uses are housing, education, water and sanitation, consumption and health-related expenses.
The RBI’s recent guidelines on the reduction of qualifying asset criteria for NBFC-MFIs from 75% to 60% open up significant opportunities for the NBFC-MFIs, especially to diversify their portfolios and strengthen financial resilience. A more diversified portfolio will allow the NBFC-MFIs to better manage sector-specific shocks, such as natural disasters or socio-political disruptions that disproportionately affect low-income microfinance borrowers. By shifting a portion of lending toward less volatile segments, the NBFC-MFIs can minimise credit losses and sustain earnings across cycles. However, most of the MLIs are following a cautious approach to this new facility.
Figure 3.8: Share of MLIs’ Income Generation Loans and Non-income Generation Loans
3.5.1 Types of Income Generation Loans and their respective share
Figure 3.9: Share of MLIs’ Income Generation Loans under Different Sub-sectors as of March 2026
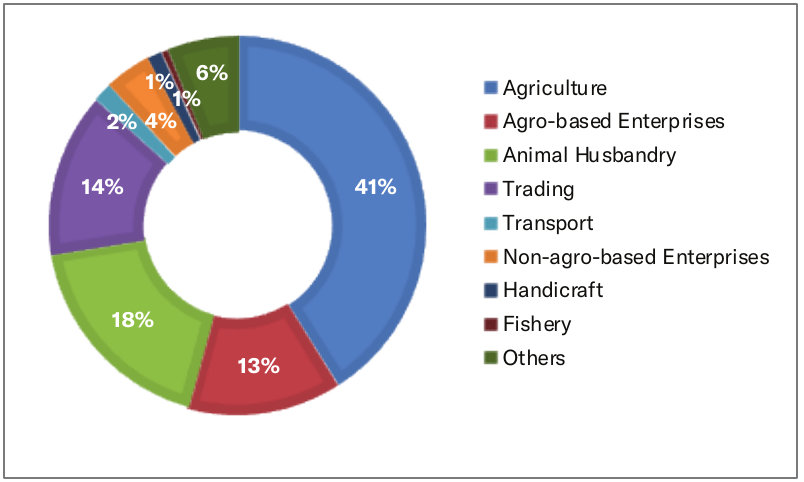
Figure 3.9 presents the distribution of income-generating loans across major sub-sectors. Agriculture accounts for the largest share at 41%, followed by animal husbandry at 18% and trading at 14% of the income-generating loan portfolio.
3.5.2 Types of Non-Income Generation Loans and their respective share
Figure 3.10: Share of MLIs’ Non-Income Generation Loans under Different Sub-sectors as of March 2026
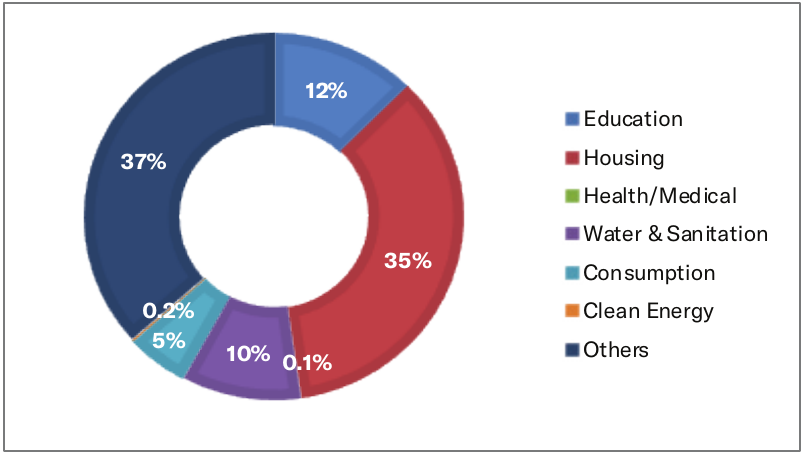
Figure 3.10 shows that housing accounts for a major share of non-income-generating loans at 35%. The remaining 65% is allocated to education, consumption, health and medical needs, water and sanitation, clean energy and other purposes. These uses address essential household needs and may support household resilience and longer-term well-being.
Note: Although there could be some variance in the actual purpose for which borrowing is done, it still gives us some idea and trend as to how the funds are used by the microfinance borrowers.
Box 3.1: Data-Driven Operational Risk Assessment Framework for Risk-Based Branch Supervision in Microfinance
To ensure consistent control standards and strengthen operational resilience across its expanding branch network, Midland Microfin Limited implemented a structured Data-Driven Operational Risk Assessment Framework that evaluates every branch on a monthly basis using predefined operational risk indicators. The framework assesses portfolio quality, governance, operational controls, fraud exposure, people risk, customer protection, audit observations, and process compliance, and classifies branches into High, Medium, or Low Risk categories.
By transforming operational data into actionable risk intelligence, the framework enables early identification of emerging vulnerabilities, supports risk-based supervision, and facilitates timely management intervention. Acting as an enterprise-wide Early Warning System (EWS), it drives targeted supervisory actions, focused audits, and corrective measures for higher-risk branches while optimising the allocation of supervisory resources in line with each branch’s risk profile.
IT-Enabled Operational Enhancements (FY 2025–26)
To complement the risk framework, Midland Microfin Limited upgraded its Loan Origination System (LOS) with advanced technological controls:
- API-Based Disbursement Controls: Introduced disbursement amount/loan count visibility and OTP-based authorization via SMS/Email to secure batches and improve governance.
- Credit Workflow & Data Validation: Integrated enriched Credit Bureau summaries (incorporating PAN, Voter ID, phone numbers, and addresses), borrower matching analytics, and robust expense validation controls.
- OCR-Based KYC Verification: Digitized document verification and KYC/bank document access to reduce manual work, accelerate customer onboarding turnaround times, and boost compliance accuracy.
Key Benefits & Strategic Outcomes
- Continuous Monitoring: Monthly risk assessments enable early detection of operational vulnerabilities before they escalate.
- Risk-Based Supervision: Supervisory visits, internal audits, and management oversight are dynamically allocated based on each branch’s risk profile, intensifying focus on High-Risk locations while maintaining routine checks on Low-Risk branches.
- Enhanced Governance: Structured dashboards provide senior management with real-time risk visibility, supporting data-driven decisions and accountability.
- Strengthened Risk Culture: Transparent categorisation encourages operational teams to strictly adhere to internal controls and risk management practices.
By combining data-driven branch risk assessments with robust IT enhancements, Midland Microfin Limited has successfully transitioned from reactive monitoring to a proactive, risk-based supervision model, optimising resources, reinforcing operational resilience, and safeguarding customer interests.
Courtesy: Midland Microfin Ltd.
3.6 Going Beyond Credit: Credit-Plus Activities of MLIs
Apart from providing microcredit to low-income households, women, small producers and informal-sector workers, MLIs are involved in non-credit activities also. The microfinance beneficiaries are vulnerable to other issues like health emergencies, climate events, education expenses and livelihood disruptions, etc. Such shocks can erode savings and productive assets and may lead to distress borrowing or repayment difficulties. Hence, many of the MLIs involve a credit-plus approach, meaning providing other financial and social services to microfinance borrowers
The credit-plus approach complements credit with savings, insurance, pension, health and livelihood support, financial literacy, digital financial services and social-security linkages. With their last-mile presence and regular customer interaction, MLIs are well placed to facilitate access to such services. Its relevance increased during FY 2025–26, as lenders placed greater emphasis on borrower assessment, repayment capacity, portfolio quality and customer servicing. Credit-plus interventions can help households manage shocks before they translate into financial distress.
3.6.1 Microinsurance and Financial Protection
Insurance provides protection against unexpected events like death, health emergencies, accidents, natural disasters and loss of productive assets. MLIs facilitate extending insurance support by engaging in awareness creation, enrolment, renewal, claims assistance and grievance support in partnership with insurance companies. All MLIs are involved in providing credit-linked life insurance to the borrowers who opts for the same. This insurance provides the borrowers cover against any outstanding loans standing on their name if any unfortunate incident of their death happens, without burdening the other family members. Some of the MLIs offer such coverage to the co-obligants also. This helps the family to tide over any unforeseen incidents resulting in the death of the borrowers or co-obligants.
During 2025-26, the MLIs that reported their data indicated offering non-loan life, health and non-life insurance, with credit-plus activities facilitating such services for 143.53 lakh clients. With regard to credit-linked insurance, almost all microfinance borrowers are covered under such insurance schemes. Additionally, significant numbers of clients are covered through non-loan term life insurance, non-loan health protection, and non-life protection.
These figures are based on reported data and may include overlapping beneficiaries. The actual figures may be higher if all credit-plus activities reported by the institutions are taken into account.
3.6.2 Savings and Financial Preparedness
Savings provide an important first line of protection against household shocks, including medical expenses, education needs, marriage, festivals and other financial needs. While NBFC-MFIs cannot accept public deposits, cooperative institutions can mobilise member savings under the applicable framework. MLIs functioning as Business Correspondents or service partners can also facilitate access to formal savings accounts and other savings and digital-payment products. During FY 2025–26, reporting MLIs facilitated savings from 53.69 lakh clients/beneficiaries, mostly through BC mode, which includes 52.42 lakh by one Trust, 1.27 lakh through MACS/Cooperative institutions and 215 through an NBFC-MFI. The figures are based on reported data and are not exhaustive.
3.6.3 Pension and Social-Security Linkages
Pension and social-security linkages are particularly relevant for informal-sector workers. MLIs, Business Correspondents and community-based organisations can support awareness, enrolment and regular contributions. Reported data indicate that a MACS/Cooperative institution facilitated pension products for 35,458 clients/beneficiaries during FY 2025–26. The figures are based on reported data and are not exhaustive.
3.6.4 Development and Livelihood Activities
Some of the MLIs, many of them with the NGO background and have developmental focus, undertake several developmental initiatives for the community benefit, alongside financial services. The NBFC-MFIs have a mandate also to spend under their CSR programmes. These instituions have taken up such activities either directly or through their foundations or partnerships with government agencies, civil-society organisations, healthcare providers and training institutions. These activities cover education, healthcare, financial literacy, livelihood promotion, women’s empowerment, training, water and sanitation, infrastructure and enterprise development. Based on reported data, more than 75.90 lakh clients benefited from developmental activities during the last financial year. The figures are based on reported data and are not exhaustive. Reported initiatives included financial literacy and digital-finance awareness, scholarships and educational support, health camps and screening, livelihood and skill development, women’s empowerment, WASH, disaster relief, nutrition, environmental awareness and community development.
The breadth of these initiatives reflects the growing role of MLIs in facilitating services beyond credit. Sa-Dhan has documented several such interventions through its CSR publication, Stories Beyond Credit, highlighting the wider social and developmental engagement of micro-lending institutions.
Box 3.2: Measuring Customer Outcomes - Assessing Impact Beyond Credit
To understand the long-term outcomes of the financial services being extended by Annapurna Microfinance, it conducted a comprehensive Customer Outcome Assessment, Annual Socio-Economic Impact Assessment, and Customer Satisfaction Survey across its Microfinance (MFI) and MSME portfolios. Together, these studies evaluated customer well-being, enterprise growth, financial resilience, service experience, and overall satisfaction, providing valuable evidence to strengthen customer-centric product design and responsible finance practices.
Driving Sustainable Economic and Social Impact
The socio-economic assessment covered 2,238 MFI customers across 12 states and 407 MSME customers across 9 states. Using a quasi-experimental research design for the MFI portfolio and a before-and-after assessment for MSMEs, the study demonstrated measurable improvements in customers’ economic and social well-being.
Among long-tenure MFI customers, average household income increased by 17% over two years compared to 1% in the control group, while savings grew by 27%, significantly outperforming the 5% increase observed among non-beneficiary households. Household spending patterns also reflected improved financial capacity, with higher expenditure on food and sustained investment in children’s education.
The assessment further highlighted meaningful improvements in living standards. Ownership of household toilets increased to 82%, the proportion of customers living in pucca houses rose substantially, household budgeting practices more than doubled from 22% to 46%, and insurance coverage reached 80%, indicating stronger financial resilience and improved access to social protection and healthcare services.
Creating Measurable Social Value
Annapurna’s Social Return on Investment (SROI) was estimated at 0.63, indicating that every ₹1 invested in long-tenure customers generated approximately ₹0.63 of adjusted net social value through improvements in income, housing, education, and food security.
Delivering a Superior Customer Experience
The annual Customer Satisfaction Survey covered 2,879 customers, including 2,393 MFI and 486 MSME respondents. Overall customer satisfaction remained exceptionally high, with 94% satisfaction among MFI customers and 95% among MSME customers across the loan lifecycle.
MFI customers reported the highest satisfaction during the loan application and approval stages, while repayment emerged as an area for further enhancement. The survey recorded a strong Net Promoter Score (NPS) of 69, reflecting high customer advocacy. More than half of MFI customers now use digital repayment channels, demonstrating increasing digital adoption.
Among MSME customers, the NPS stood at 68, with customers expressing strong satisfaction with loan processing while identifying opportunities to simplify fee structures and expand doorstep services. Across both portfolios, customers prioritized higher loan limits, faster turnaround time, and simplified documentation, providing important direction for future product innovation and service improvements.
These findings reaffirm Annapurna Finance’s commitment to responsible, customer-centric finance by continuously measuring customer outcomes and translating insights into better products, stronger service delivery, and sustainable community impact.
Impact Highlights
- Enhanced Economic Well-being: Long-tenure MFI customers experienced a 17% increase in household income and 27% growth in savings, demonstrating stronger financial stability and improved livelihood outcomes.
- Improved Quality of Life and Resilience: Increased access to pucca housing, sanitation, insurance, and household budgeting practices reflects greater financial resilience, better living standards, and improved social well-being.
- Strong Customer Trust and Satisfaction: Customer satisfaction remained exceptionally high at 94% (MFI) and 95% (MSME), supported by strong Net Promoter Scores (69 and 68), indicating high customer confidence and loyalty.
- Evidence-Based Customer-Centric Improvements: Customer feedback and impact assessments are actively guiding product innovation, faster service delivery, simplified processes, and responsible finance practices, creating sustainable value for customers and communities.
Courtesy: Annapurna Finance Pvt. Ltd.
3.7 Conclusion
The microfinance sector is entering FY 2026–27 in a position of stabilisation and consolidation with signs of improvement in asset quality and improved recovery in lending activity. To translate these developments into sustainable and positive growth, MLIs need to recalibrate their strategies around risk management, diversified lending, digital efficiency, product innovation, funding diversification, and stronger adherence to the RBI’s regulatory framework for microfinance.
Digital transformation is increasingly becoming central to improving cost efficiency, expanding outreach, and strengthening risk control. MLIs are deploying digital-first lending models, automating loan origination and collections, and leveraging fintech partnerships and AI-driven underwriting to improve decision-making while reducing field staff attrition-related disruptions. Data analytics are being used to segment borrowers more precisely, target underserved geographies, and optimise branch networks, thereby lowering operating costs and improving customer experience without compromising risk discipline. In parallel, institutions are preparing for RBI’s proposed unified interest-rate framework and suitability norms by strengthening governance around pricing, ensuring transparent Key Fact Statements (KFS), and aligning incentive structures to avoid mis-selling.
Product and funding diversification are key to resilience. MLIs are expanding beyond traditional JLG loans into housing microfinance, loans against property, and MSME finance, taking advantage of RBI’s relaxed norms on non-qualifying assets for NBFC-MFIs to build more balanced portfolios. On the liability side, institutions are exploring securitisation, co-lending with banks, and other market instruments to reduce cost of funds and lengthen tenors, while maintaining adequate liquidity buffers in line with RBI’s emphasis on liquidity risk management for NBFCs. By coupling these strategic shifts with strong borrower protection, financial literacy initiatives, and strict adherence to fair practices, the sector is positioning itself to deliver stable, inclusive growth in FY 2026-27.
On the whole, the sector is on the cusp of a growth phase, and it needs to be supported proper risk management, diversified lending, responsible scaling, tighter underwriting, gradually digitising end-to-end operations, diversifying products and resource mobilisation, and deepening regulatory and ethical compliance. The MLIs also need to ensure embedding climate, social, and livelihood enterprise financing into their core. By continuing on this path, MLIs are not only protecting asset quality and profitability but are also reinforcing their role as a critical enabler of financial inclusion, income generation, MSME growth, and women’s economic empowerment.