


Chapter 1.4Inflation: Beyond the Headline, to the Borrower’s Own Basket
Of the nine channels, inflation is the fastest and least leaky. It requires no intermediary and no lag; a price change reaches the household in the week it occurs. It is also the variable most commonly misread, because the headline index is not the index the borrower lives in.


Indian Microfinance: Resilience, Responsibility & Inclusion Ramesh Srivatsava Arunachalam
1.4 Inflation: Beyond the Headline, to the Borrower’s Own Basket
Policy reaches the household through institutions, and therefore slowly. Prices reach it directly. Of the nine channels, inflation is the fastest and least leaky. It requires no intermediary and no lag; a price change reaches the household in the week it occurs. It is also the variable most commonly misread, because the headline index is not the index the borrower lives in. The Consumer Price Index (CPI) measures a representative basket, and a microfinance borrower household does not consume the representative basket: it consumes one weighted far more heavily towards food, fuel and transport and far less towards housing rent, durables and discretionary services. In the outgoing 2012-base series, food and beverages carried a weight of approximately 45.9 per cent in the all-India index, and for households in the lower expenditure deciles the food share is materially higher.33
The index was rebased to 2024 with effect from February 2026, but the structural point survives the rebasing, since the divergence between an average basket and a low-income basket is a property of the income distribution rather than of any base year. That divergence generates a concept proposed here as an analytical instrument: the microfinance borrower’s effective inflation rate, defined as the rate of increase in the cost of the specific consumption basket of a low-income household, computed using that household’s own expenditure weights. Its construction is straightforward — published category-level rates are reweighted using expenditure shares characteristic of the borrower household. It has an important property frequently overlooked: it does not always run above the headline.
When inflation is food-led, the borrower’s effective rate exceeds the headline, and the household experiences greater compression than national commentary suggests. When disinflation is food-led, the relationship inverts, and the household experiences greater relief than the national statistic implies. Figure 1.5 sets out both cases.
Figure 1.5: The borrower’s basket cuts both ways
(Illustrative effective inflation rate under two regimes, average versus low-income weights)
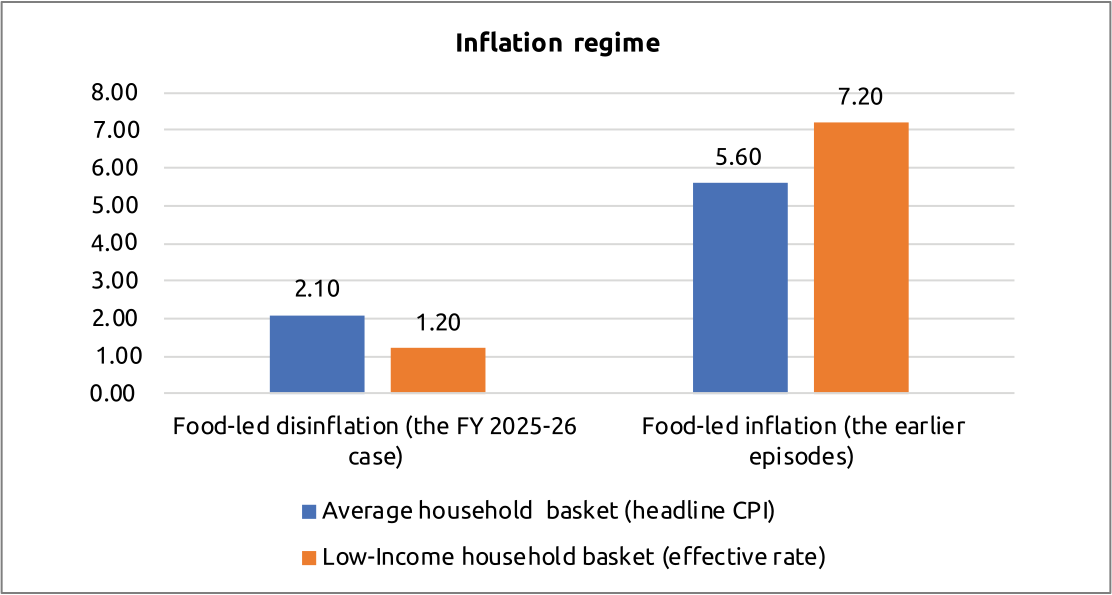
Food-led disinflation places the borrower’s effective rate below the headline.
Illustrative computation by the author, applying category inflation rates to differing expenditure weights. Not an official series.
FY2025-26 was decisively the second case, and this is one of the most consequential and least remarked facts of the period. Retail inflation fell to levels not recorded in a generation, slipping below the lower bound of the tolerance band during the second quarter. In the closing months of calendar 2025, rural headline inflation touched approximately zero and briefly turned marginally negative, with the consumer food price index recording outright deflation in the rural sector. Figure 1.6 traces the path, including the series break at the February 2026 rebasing.
Figure 1.6: A generation’s low, then a normalisation34
(Headline retail inflation, selected months, December 2024 to July 2026)
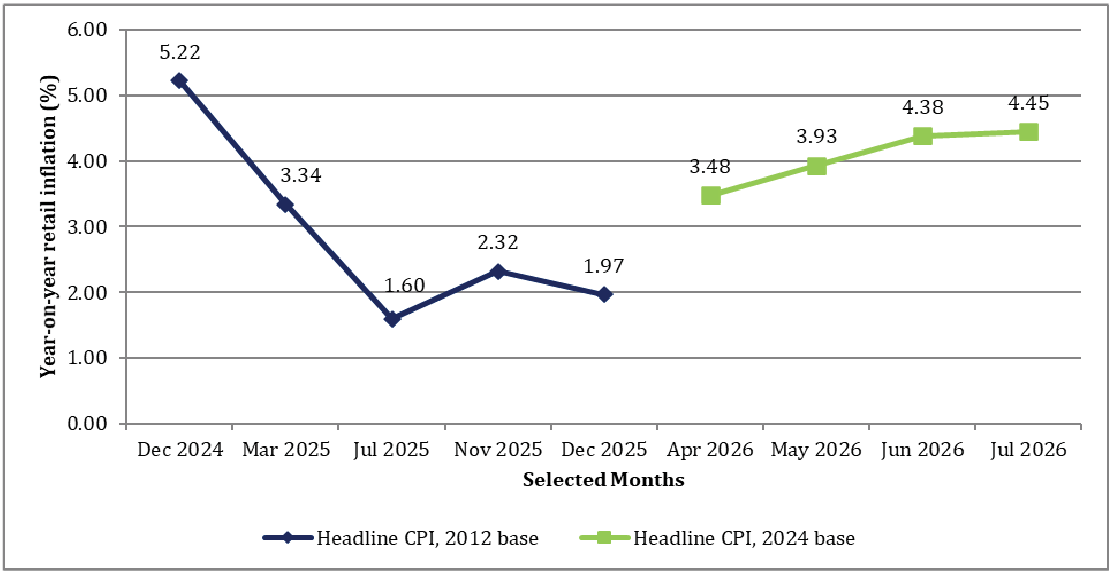
Rural headline inflation touched approximately zero in late 2025 — below the all-India print shown here.
The composition of that disinflation is what makes it significant. It was concentrated in food, driven by two successive strong agricultural seasons and record output. A household spending half or more of its budget on food, in a year in which food prices were flat to falling, experienced an effective inflation rate below an already very low headline. Set against nominal income growth from a record harvest, employment-intensive services expansion and robust remittances, this produced the largest single-year real income gain for low-income households in the period under review. For a lender, the causal chain is direct: food disinflation reduces essential expenditure in real terms, which expands the household surplus, which strengthens debt-servicing capacity, which improves collection efficiency, which reduces portfolio at risk.35 Underwriting discipline explains part of the FY2025-26 improvement; the borrower’s household budget explains a great deal of the rest. An honest reading requires noting the lines that moved differently. Education inflation remained firm and is a rising share of the low-income budget, concentrated seasonally in the first quarter and among the most common stated purposes of borrowing at that point in the calendar. Health inflation likewise remained firm, and health expenditure is both large and unpredictable. Precious metals rose sharply, and for the low-income household gold is not a consumption item at all but the principal store of value — so rising prices strengthen the balance sheet by revaluing the buffer stock upward even as they raise the cost of replenishing it. Table 1.4 sets out the components of the borrower’s basket alongside their direction during the year.
Table 1.4: The borrower’s basket: approximate weights and direction during FY2025-26
| Expenditure category | Approximate weight, all-India basket | Direction of weight in a low-income basket | Direction of prices, FY2025-26 | Net effect on household surplus |
|---|---|---|---|---|
| Food and beverages | approx. 45.9% | Materially higher | Falling; rural food deflation in late 2025 | Strongly favourable |
| Fuel and light | approx. 6.8% | Higher | Broadly stable to soft | Favourable |
| Transport and communication | approx. 8.6% | Higher for enterprise households | Soft, firming late in the period | Mildly favourable |
| Housing | approx. 10.1% | Materially lower | Stable | Neutral |
| Education | approx. 4.5% | Rising over time | Firm | Unfavourable and seasonal |
| Health | approx. 5.9% | Rising over time | Firm | Unfavourable and unpredictable |
| Precious metals | Small | Buffer rather than consumption | Sharply higher | Favourable through buffer revaluation |
Note: weights shown are approximate all-India shares under the outgoing 2012-base series, indicated for structural illustration. The index was rebased to 2024 with effect from February 2026. Low-income basket direction is indicative and not an official series.
By May 2026 the picture had begun to normalise, and three further months of data have confirmed that reading in the direction the instrument predicted. Headline inflation rose to 4.38 per cent in June 2026 and 4.45 per cent in July, a nineteen-month high and the second consecutive month above the 4 per cent target after sixteen months below it, with food inflation at 5.52 per cent.36,37 More to the point for this readership, the rural-urban gap did not close but widened: rural headline inflation reached 4.84 per cent in July against 3.96 per cent urban, and rural food inflation 5.79 per cent against 5.05 per cent urban.38,39 Within the food group, the movement was concentrated in exactly the volatile, high-frequency items that dominate a poor household’s daily purchase, with onion inflation accelerating to 22.5 per cent from 4.7 per cent in a single month.40 The borrower’s effective inflation rate is therefore now running above the headline, and the disinflation dividend is being handed back at a measurable rate. The practical instruction is specific. A microfinance institution should not track headline CPI; it should construct and track its own borrowers’ effective inflation rate, using published category-level data reweighted by the expenditure shares observed in its own client base — data most institutions already collect at loan appraisal and simply do not aggregate. The value is no longer hypothetical. An institution that had constructed this measure in May 2026 would have read the widening rural-urban gap as an early signal; one tracking headline CPI alone would have seen a rate still comfortably inside the tolerance band and concluded that nothing had changed.