


Chapter 3APerformance of NBFC-MFIs in Microfinance
NBFC-MFIs are major players in delivering microfinance services to low-income households. This category of institutions was created by the RBI following the recommendations of the Malegam Committee, with a focus on micro-lending. The RBI has prescribed specific norms for classifying loans as microfinance loans, generally referred to as qualifying assets, and has also specified the minimum proportion of such assets that an institution must maintain to qualify for registration as an NBFC-MFI (presently it is adjusted to 60% of total assets).


Performance of NBFC-MFIs in Microfinance
NBFC-MFIs are major players in delivering microfinance services to low-income households. This category of institutions was created by the RBI following the recommendations of the Malegam Committee, with a focus on micro-lending. The RBI has prescribed specific norms for classifying loans as microfinance loans, generally referred to as qualifying assets, and has also specified the minimum proportion of such assets that an institution must maintain to qualify for registration as an NBFC-MFI (presently it is adjusted to 60% of total assets).
NBFC-MFIs also share a similar regulatory framework with other NBFCs. In addition, they have specialized parameters to consider as an NBFC-MFI. Under the Scale-Based Regulation (SBR), the Reserve Bank of India introduced a regulatory structure that categorises all NBFCs into four layers based on their size, activity, and perceived riskiness. Out of the total 93 NBFC-MFIs registered with the RBI, 25 fall under the ‘Middle’ layer (non-deposit-taking NBFC with asset size above ₹1,000 Cr), and the rest are under the ‘Base’ layer (NBFC-ND with asset size below ₹1,000 Cr).
RBI has also mandated other guidelines such as appointment of an internal ombudsman, the Prompt Corrective Action (PCA) Framework, and defining the role of Compliance Officers for NBFCs, which also apply to NBFC MFIs. Additionally, the RBI introduced a comprehensive Regulatory Framework for Microloans to govern household income caps and pricing.
3.A.1 Distribution of NBFC-MFIs across region and size
Table 3.A.1: Region-wise distribution of NBFC-MFIs1
| Region | State/UT | No. of NBFC-MFIs |
|---|---|---|
| North | Delhi (11), Rajasthan (2), Punjab (1) | 14 |
| East | Bihar (1), Odisha (3), West Bengal (13) | 17 |
| West | Gujarat (6), Maharashtra (11) | 17 |
| South | Karnataka (11), Keralam (1), Tamil Nadu (16), Telangana (3) | 31 |
| North East | Assam (6), Manipur (1) | 7 |
| Central | Uttar Pradesh (6), Chhattisgarh (1) | 7 |
| Total | 93 |
1 Based on the RBI data as on June 2026
Table 3.A.2 Size-wise distribution of NBFC-MFIs
| Size | No. of NBFC-MFIs | Gross Loan Portfolio (₹ in Cr.) | Share out of the total Portfolio |
|---|---|---|---|
| Nano (<₹100 Cr.) | 40 | 1,455 | 0.89% |
| Small (₹100 Cr.-₹500 Cr.) | 19 | 4,346 | 2.64% |
| Medium (₹500 Cr.-₹2,000 Cr.) | 10 | 12,457 | 7.58% |
| Large (₹2,000 Cr. - ₹5,000 Cr.) | 7 | 23,486 | 14.29% |
| Very Large (>₹ 5,000 Cr.) | 9 | 1,22,656 | 74.61% |
| Total | 85 | 1,64,400 |
Note: The above table (3.A.2) is based on the self-reported data, whereas the table (3.A.1) is based on the RBI-registered NBFC-MFIs. Out of these 93 NBFC-MFIs registered with RBI, some of them are non-functional or inactive.
The NBFC-MFI segment is highly concentrated, with 9 very large institutions accounting for 74.61% or ₹1,22,656 crore of the total portfolio, while 7 large institutions contribute 14.29%. In contrast, 69 nano, small and medium NBFC-MFIs together account for only 11.11%. This indicates that the sector’s portfolio is predominantly concentrated among a relatively small number of very large NBFC-MFIs.
3.A.2 Geographical Spread
The geographical coverage of NBFC-MFIs varies considerably by their size. The widest coverage is reported by a single NBFC-MFI, which operates across 30 States/UTs, indicating a significant geographical reach. Table 3A.3a indicates a mix of geographically focused and widely diversified institutions.
Table 3 A.3: No. of NBFC-MFIs Operating across States/UTs
| No. of States/UTs | No. of NBFC-MFIs |
|---|---|
| 1 | 12 |
| 2 to 5 | 38 |
| 6 to 10 | 13 |
| 11 to 20 | 14 |
| >20 | 8 |
| Total | 85 |
Table 3 A.4: No. of NBFC-MFIs that added new state(s) and closed existing state(s) during FY 2025-26
| Size | No. of NBFC-MFIs that expanded to New State(s) during FY 2025–26 | No. of NBFC-MFIs that closed State(s) operations during FY 2025–26 |
|---|---|---|
| Nano (<₹100 Cr.) | 2 | 3 |
| Small (₹100 Cr.-₹500 Cr.) | 3 | 0 |
| Medium (₹500 Cr.-₹2,000 Cr.) | 0 | 0 |
| Large (₹2,000 Cr. - ₹5,000 Cr.) | 2 | 0 |
| Very Large (>₹ 5,000 Cr.) | 3 | 1 |
| Total | 10 | 4 |
During FY 2025–26, 10 NBFC-MFIs expanded into new States, while 4 closed operations in existing States. Expansion was reported across all size categories except medium NBFC-MFIs.
Table 3 A.5: No. of NBFC-MFIs that added new districts and closed existing districts during FY 2025-26
| Size | No. of NBFC-MFIs that expanded to new districts during FY 2025–26 | No. of NBFC-MFIs that closed district operations during FY 2025–26 |
|---|---|---|
| Nano (<₹100 Cr.) | 7 | 6 |
| Small (₹100 Cr.-₹500 Cr.) | 10 | 3 |
| Medium (₹500 Cr.-₹2,000 Cr.) | 2 | 3 |
| Large (₹2,000 Cr. - ₹5,000 Cr.) | 3 | 4 |
| Very Large (>₹ 5,000 Cr.) | 7 | 6 |
| Total | 29 | 22 |
During FY 2025–26, 29 NBFC-MFIs expanded into new districts, while 22 closed operations in existing districts.
Table 3.A.6: No. of NBFC-MFIs Operating across Districts
| No. of Districts | No. of NBFC-MFIs |
|---|---|
| 1 to 20 | 31 |
| 21 to 50 | 22 |
| 51-150 | 15 |
| 151 to 400 | 11 |
| 400 | 6 |
| Total | 85 |
3.A.3 Branch Network
Table 3.A.7 Distribution of Branches across various sizes of NBFC-MFIs
| Size | Total Branches at the beginning of April 2025 | Total Branches added during FY 2025-26 | Total Branches closed during FY 2025-26 | Total Branches at the end of March 2026 |
|---|---|---|---|---|
| Nano (<₹100 Cr.) | 2,009 | 164 | 718 | 1,455 |
| Small (₹100 Cr.-₹500 Cr.) | 1,766 | 94 | 76 | 1,784 |
| Medium (₹500 Cr.-₹2,000 Cr.) | 2,672 | 155 | 84 | 2,743 |
| Large (₹2,000 Cr. - ₹5,000 Cr.) | 6,183 | 455 | 547 | 6,091 |
| Very Large (>₹ 5,000 Cr.) | 14,511 | 931 | 347 | 15,095 |
| Total | 27,141 | 1,799 | 1,772 | 27,167 |
The NBFC-MFI branch network remained broadly stable during FY 2025–26, increasing marginally from 27,141 to 27,167 branches. A total of 1,799 branches were added, while 1,772 were closed, resulting in a net addition of 27 branches. Very Large NBFC-MFIs accounted for the largest share of the network, with 15,095 branches (56%) at the end of March 2026.
3.A.4 Workforce in NBFC-MFIs
Table 3.A.8 Size-wise distribution of Staff
| Size | No. of Loan Officers (Men) | No. of Loan Officers (Women) | Field Managerial Staff (Men) | Field Managerial Staff (Women) | Head Office Staff (Men) | Head Office Staff (Women) | Total Staff |
|---|---|---|---|---|---|---|---|
| Nano (<₹100 Cr.) | 3,472 | 494 | 890 | 56 | 937 | 247 | 6,096 |
| Small (₹100 Cr.-₹500 Cr.) | 4,153 | 572 | 2,002 | 74 | 1,275 | 255 | 8,331 |
| Medium (₹500 Cr.-₹2,000 Cr.) | 10,847 | 495 | 4,282 | 210 | 2,128 | 491 | 18,453 |
| Large (₹2,000 Cr. - ₹5,000 Cr.) | 25,193 | 2,665 | 12,013 | 696 | 1,358 | 774 | 42,699 |
| Very Large (>₹ 5,000 Cr.) | 74,691 | 10,210 | 35,493 | 3,799 | 5,224 | 1043 | 1,30,460 |
| Total | 1,18,356 | 14,436 | 54,680 | 4,835 | 10,922 | 2810 | 2,06,039 |
The data show that staff strength is highly concentrated among larger institutions. Institutions with a portfolio above ₹5,000 crore account for 1,30,460 staff, or about 63% of total employment, while those below ₹500 crore account for only about 16% collectively. Loan officers constitute the largest workforce, with 1,32,792 staff (men and women combined), reflecting the field-intensive nature of microfinance operations. Women account for 22,081 staff (about 10.7%) across the reported categories, indicating relatively lower female representation, particularly in loan officer and managerial roles. Overall, the sector employed 2,06,039 staff across the participating NBFC-MFIs.
Table 3 A.9: Size-wise staff added and left during Financial Year 2025-26
| Size | No. of Staff recruited during Financial Year 2025-26 | No. of Staff Left/Exited during Financial Year 2025-26 |
|---|---|---|
| Nano (<₹100 Cr.) | 2,184 | 5,300 |
| Small (₹100 Cr.-₹500 Cr.) | 4,233 | 5,166 |
| Medium (₹500 Cr.-₹2,000 Cr.) | 11,182 | 13,672 |
| Large (₹2,000 Cr. - ₹5,000 Cr.) | 21,769 | 34,189 |
| Very Large (>₹ 5,000 Cr.) | 83,325 | 80,852 |
| Total | 1,22,693 | 1,39,179 |
NBFC-MFIs reported 1.23 lakh staff recruited against 1.39 lakh staff exits during FY 2025–26, indicating a net decline of 16,486 staff. The Very Large NBFC-MFIs accounted for about 68% of recruitment and 58% of exits.
Figure 3.A.1 Distribution of staff across size-wise categories
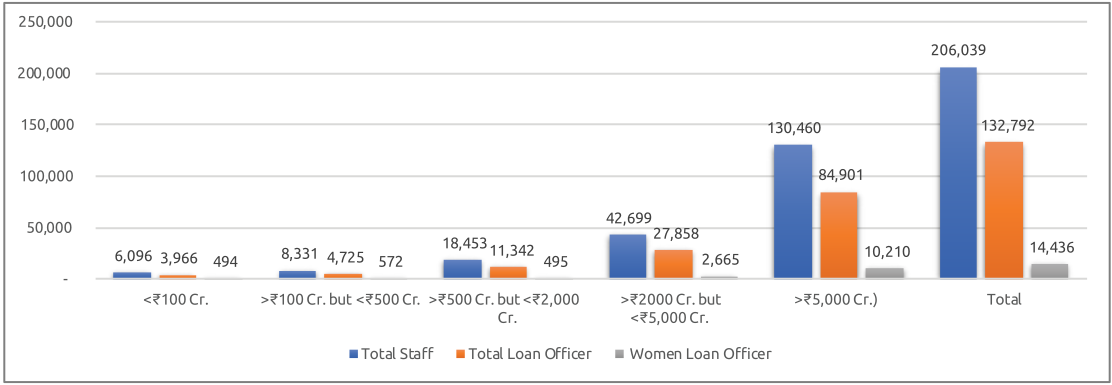
The data indicate that larger institutions account for the bulk of employment and loan officers. Institutions with a portfolio above ₹5,000 crore employ 1,30,460 staff, including 84,901 loan officers, representing about 63% and 64% of the respective totals. Overall, loan officers constitute 1,32,792 (64%) of total staff, while women loan officers number 14,436, accounting for about 11% of all loan officers. Female representation among loan officers is relatively higher in the smallest size category (about 12.5%) and remains around 10–11% across the larger categories.
3.A.5 Client Outreach
Table 3.A.10 Distribution of Active borrowers
| Size | No. of Clients (in Lakh) under On-BS Portfolio | No. of Clients (in Lakh) under Off-BS Portfolio | Total No. of Clients | ||||
|---|---|---|---|---|---|---|---|
| Microfinance Loan | Non-microfinance Loan | Total | Microfinance Loan | Non-microfinance Loan | Total | ||
| <₹100 Cr. | 3.2 | 0.5 | 3.7 | 1.1 | 0.1 | 1.2 | 5 |
| ₹100 Cr.-₹500 Cr. | 6.1 | 1.2 | 7.4 | 5.7 | 0.9 | 6.6 | 14 |
| ₹500 Cr.-₹2,000 Cr. | 21.1 | 1.9 | 23.1 | 11.0 | 1.7 | 12.7 | 36 |
| ₹2,000 Cr. - ₹5,000 Cr. | 53.7 | 2.8 | 56.5 | 9.9 | 3.0 | 12.9 | 69 |
| >₹ 5,000 Cr | 197.9 | 10.3 | 208.2 | 38.7 | 17.2 | 55.9 | 264 |
| Total | 282 | 17 | 299 | 66 | 23 | 89 | 388 |
| Percentage | 94% | 6% | 74% | 26% | |||
The above Table (3 A.10) shows that the on-balance-sheet (On-BS) portfolio serves the majority of clients, with 299 lakh clients, compared with 89 lakh clients under Off-BS portfolios, taking the total to 388 lakh clients. Microfinance loans account for the vast majority of clients in both On-BS and Off-BS portfolios. Institutions with portfolios above ₹5,000 crore serve 264 lakh clients, or about 68% of the total, highlighting the strong concentration of client outreach among larger MLIs.
3.A.6 Portfolio
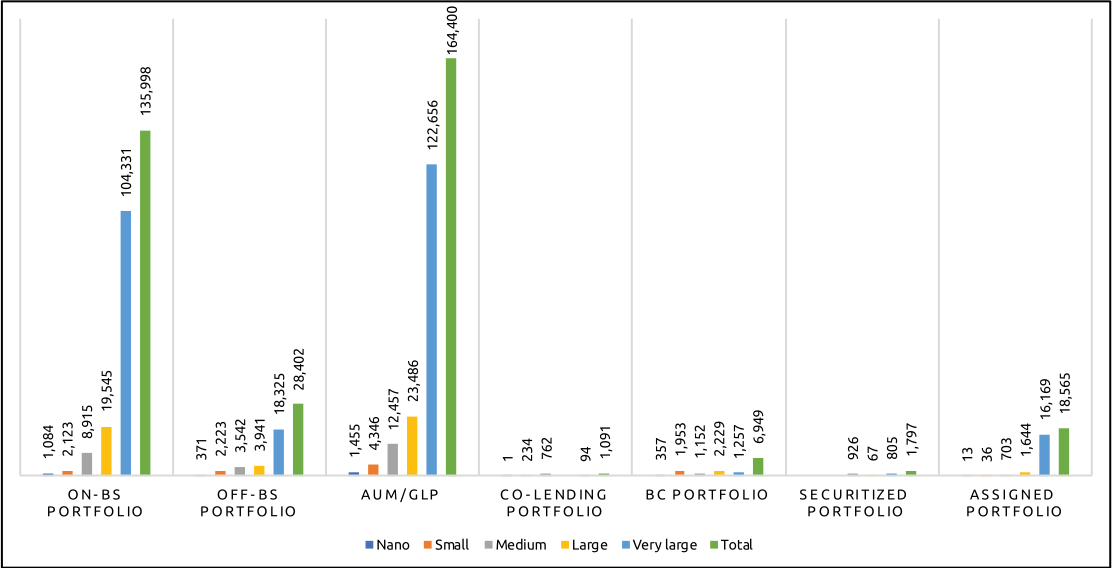
The data show that the total AUM/GLP of ₹1,64,400 crore is predominantly concentrated among Very Large institutions, which account for ₹1,22,656 crore (about 75%). The On-BS portfolio constitutes ₹1,35,998 crore (83%), while the Off-BS portfolio contributes ₹28,402 crore (17%). Out of the off-balance-sheet portfolio, Assigned Portfolio (₹18,565 crore) is the largest, followed by BC Portfolio (₹6,949 crore), Securitised Portfolio (₹1,797 crore) and Co-lending (₹1,091 crore). This indicates that the sector remains strongly dependent on on-balance-sheet lending, with larger institutions accounting for the bulk of the overall portfolio and diversified off-balance-sheet activities.
Figure 3.A.2 Size-wise distribution of portfolio across various categories
3.A.7 Disbursement
Table 3.A.11 Distribution of disbursement based on the size of NBFC-MFIs
| Size | Number of loans disbursed under On-Balance Sheet Portfolio (in lakhs) | Number of loans disbursed under Off Balance Sheet Portfolio(in lakhs) | Total Loan disbursed (in lakhs) | Amount disbursed under On-Balance Sheet Portfolio (in ₹ Cr) | Amount disbursed under Off Balance Sheet Portfolio (in ₹ Cr) | Total amount disbursed (in ₹ Cr) Loan | Average Ticket Size (₹) |
|---|---|---|---|---|---|---|---|
| Nano (<₹100 Cr.) | 2.62 | 0.39 | 3.00 | 1,249 | 99 | 1,349 | 44,911 |
| Small (₹100 Cr.-₹500 Cr.) | 6.70 | 0.06 | 6.76 | 3,232 | 45 | 3,277 | 48,514 |
| Medium (₹500 Cr.-₹2,000 Cr.) | 12.82 | 2.66 | 15.48 | 8,084 | 1,460 | 9,544 | 61,640 |
| Large (₹2,000 Cr. - ₹5,000 Cr.) | 32.52 | 2.47 | 34.99 | 16,851 | 1,881 | 18,733 | 53,535 |
| Very Large (>₹ 5,000 Cr.) | 134.38 | 21.68 | 156.06 | 79,883 | 17,538 | 97,421 | 62,425 |
| Total | 189 | 27 | 216 | 1,09,300 | 21,024 | 1,30,324 | 60,253 |
The data indicate that 216 lakh loans amounting to ₹1,30,324 crore were disbursed, with microfinance loans accounting for 189 lakh loans (87.5%) and ₹1,09,300 crore (83.9%) of the total. Very Large institutions dominated disbursement, contributing 156.06 lakh loans and ₹97,421 crore, or about 75% of the total amount disbursed. The overall average ticket size stood at ₹60,253, while the size-wise ticket size ranged from ₹44,911 for Nano institutions to ₹62,425 for Very Large institutions, indicating broadly higher average loan sizes among larger institutions.
3.A.8 Portfolio Quality
Portfolio quality for all buckets (PAR >30 days and PAR >60 days, PAR>90 days, and PAR >180 days) has improved. Some NBFC-MFIs are reporting elevated PAR levels due to long-outstanding dues that remain unrecovered. The analysis is based on self-reported portfolio data from 85 NBFC-MFIs. The portfolio quality figures differ from those presented in Chapter 2 because MLI data reported to the CICs include technical write-offs, whereas the MLI data submitted to the SROs exclude technical write-offs.
The PAR value for various buckets for different sizes of NBFC-MFIs is depicted in the table below.
Table 3 A.12: Portfolio Quality of NBFC-MFIs under different buckets (Based on weighted average values)
| Size | PAR>30 days | PAR>60 days | PAR>90 days | PAR>180 days |
|---|---|---|---|---|
| Nano (<₹100 Cr.) | 6.95% | 6.00% | 5.44% | 5.04% |
| Small (₹100 Cr.-₹500 Cr.) | 7.75% | 6.62% | 5.14% | 3.98% |
| Medium (₹500 Cr.-₹2,000 Cr.) | 7.87% | 7.20% | 6.34% | 4.47% |
| Large (₹2,000 Cr. - ₹5,000 Cr.) | 7.01% | 6.24% | 5.65% | 4.29% |
| Very Large (>₹ 5,000 Cr.) | 4.96% | 4.67% | 4.31% | 3.50% |
| Overall | 5.56% | 5.15% | 4.69% | 3.71% |
Note: DPD>30 days = all overdues above 30 days, including above 180 days; DPD>60 days = all overdues above 60 days, including above 180 days; DPD>90 days = all overdues above 90 days, including above 180 days. The portfolio quality figures differ from those presented in Chapter 2 because MLI data reported to CICs exclude technical write-offs, whereas data submitted to SROs include technical write-offs.
Box 3A.1: Cybersecurity Risk Management and Operational Resilience
As microfinance institutions increasingly adopt digital operations, cybersecurity and operational resilience have become critical to safeguarding customer data, ensuring uninterrupted services, and meeting regulatory expectations. While many of the MFIs are adopting cybersecurity measures, there is a specific case of SAVE Microfinance Pvt. Ltd. (SMPL). In case of SMPL, it has integrated cybersecurity, operational risk management, business continuity, and governance into its enterprise risk management framework.
SMPL regularly conducts Vulnerability Assessment and Penetration Testing (VAPT), Information Systems Audits, application security assessments, secure configuration reviews, and compliance assessments to identify vulnerabilities and strengthen security controls. Role-based access controls, periodic access reviews, audit logging, and continuous monitoring further protect critical systems from unauthorised access.
To build a strong security culture, the institution conducts regular employee awareness programmes on phishing, ransomware, malware, password security, social engineering, multi-factor authentication, cyber incident reporting, fraud prevention, and secure information handling.
Operational risks are managed through systematic risk assessments, standard operating procedures, maker-checker controls, segregation of duties, exception monitoring, and management oversight. Vendor and third-party risks are addressed through due diligence, contractual safeguards, periodic reviews, and performance monitoring.
SMPL has also strengthened its operational resilience through Business Continuity Planning (BCP), Disaster Recovery (DR) arrangements, secure data backups, and regular resilience testing. These measures enable uninterrupted customer service during disruptions while supporting regulatory compliance.
The institution’s governance framework is reinforced through Board oversight, internal policies, independent audits, compliance reviews, and structured reporting mechanisms that promote transparency, accountability, and continuous improvement.
Key Outcomes
- Enhanced protection of customer information and critical business systems.
- Stronger cybersecurity through regular security assessments and employee awareness.
- Improved operational resilience through Business Continuity and Disaster Recovery planning.
- Strengthened governance, internal controls, and regulatory compliance.
- Better preparedness to detect, respond to, and recover from cyber and operational incidents.
- Increased stakeholder confidence and long-term institutional sustainability.
SMPL has demonstrated that embedding cybersecurity, operational resilience, governance, and enterprise risk management into day-to-day operations creates a secure, resilient, and future-ready microfinance institution while strengthening customer trust and supporting sustainable financial inclusion.
Courtesy: SAVE Microfinance Pvt. Ltd. (SMPL)
3.A.9 Pricing of Credit
The cost structure indicates a clear scale advantage among larger institutions. The average Cost of Funds declined across all institution-size categories except Small, while average operating cost decreased more significantly, from 11.87% for Nano institutions to 7.57% for Very Large institutions. This cost advantage is also reflected in the average interest rate, which declined from 26.38% for Nano MLIs to 23.66% for Very Large institutions, with the overall average at 23.79%. There are two NBFC-MFIs that charge a weighted average interest rate of less than 20% to their microfinance borrowers.
In addition to Operating Cost and Cost of Funds, NBFC-MFIs incur Credit Loss/Provisioning Costs, Technology and Digital Costs, Fraud and Operational Risk Losses, Collection and Recovery Costs, and other associated expenses. After accounting for these costs, the residual margin from interest income remains relatively thin.
Figure 3 A.3: Cost of Funds, Operating Cost and Interest Rate (Based on weighted average values)
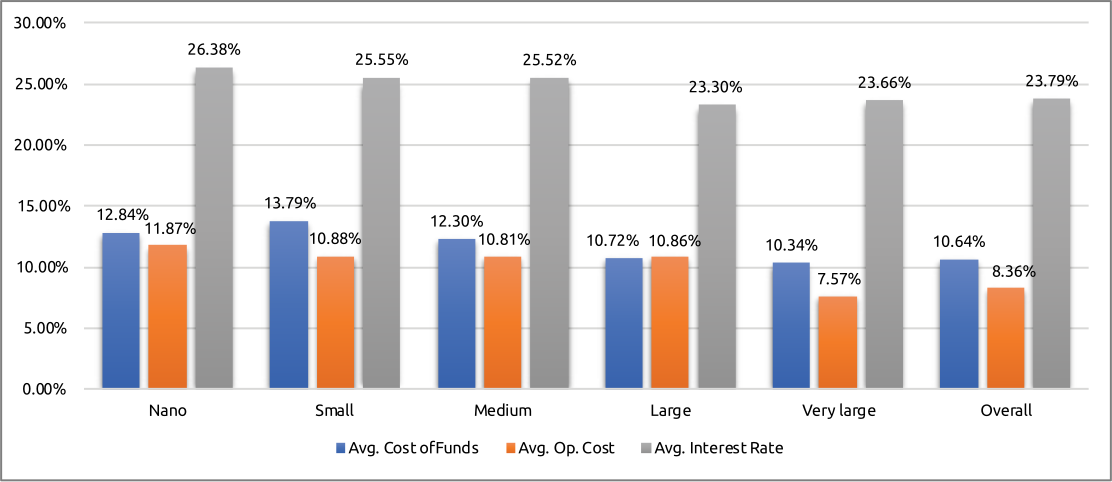
Note: Beyond Operating Cost and Cost of Funds, NBFC-MFIs incur credit loss, technology, fraud, collection and other costs. After accounting for these expenses, the residual margin from interest income remains relatively thin.
Table 3.A.13: Number of NBFC-MFIs under various ranges of weighted average interest rate charged to Microfinance Borrowers
| Interest rate range | Number of NBFC-MFIs |
|---|---|
| Less than 20% | 4 |
| 20%-24% | 20 |
| 25%-26% | 27 |
| 27%-28% | 18 |
| Above 28% | 6 |
3.A.10 Funding
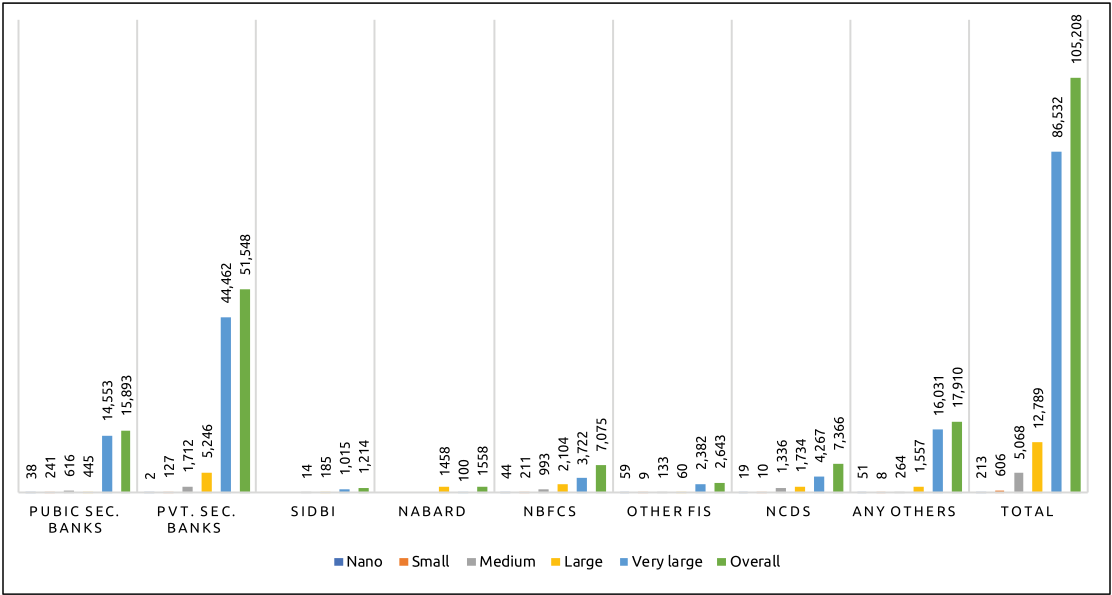
The funding pattern indicates a strong shift toward private sector banks and other diversified financial sources as institution size increases. Overall funding was ₹1,05,208, with Private Sector Banks contributing the largest share (₹51,548), followed by Any Others (₹17,910) and Public Sector Banks (15,893). Very Large institutions accounted for the bulk of total funding (₹86,532; over 82%), with Private Sector Banks contributing ₹44,462 and Any Others ₹16,031, highlighting the greater access to diversified and larger funding sources.
Figure 3 A.4: Source-wise Funds received (₹ in Cr) by different sizes of NBFC-MFIs in FY 2025-26
Box: 3A.2 SANKALP 3.0: Guardrails for Micro Lending Institutions (MLIs)
The microfinance sector went through some stressful times in the last few months. Sensing the stress in the microfinance sector, Sa-Dhan convened a meeting of CEOs of MFIs and other institutions on 10th April 2026 in Mumbai, wherein it was decided to continue with the SANKALP 2.0 guardrails for another year.
Three key issues to be addressed through guardrails are:
- Pricing: Transparent and fair pricing of loans
- Over-indebtedness: Control Over-lending and overexposure.
- Discipline: Adherence to the Code of Conduct and Responsible lending practices.
The new set of guardrails in the form of SANKALPS (combining both the Sankalps) is as under:
Over Indebtedness
Guardrail 1: The number of lenders for microfinance loans shall not exceed 3 (THREE), from all types of lenders.
Guardrail 2: While considering a fresh loan, the combined exposure of a household in microfinance and unsecured retail loans shall not exceed ₹2,00,000, subject to RBI-prescribed repayment obligation cap of 50% of the household’s monthly income.
Guardrail 3: No fresh loan to the same borrower whose existing loan is still continuing as outstanding, before 12 months of disbursement or has not completed 50% repayment
Guardrail 4: Every microfinance loan should mandatorily do a comprehensive credit bureau check at the household level.
Pricing of Loans
Guardrail 5: Lending Institutions should follow transparent practices in deciding the pricing of loans. Components of the rate of interest (Cost of Funds, Opex Cost, Risk Margin and Margin) should be well defined and in compliance with guidelines issued from time to time. The Rate of Interest should be justifiable and approved by the Board of lending institutions.
Guardrail 6: Processing fee to be capped at 1.5% (excluding applicable taxes)
Code of Conduct and Discipline
Guardrail 7: No loan to be given to clients who is in default of any loan amount, and such due shall not exceed ₹3,000 and remain unpaid for more than 60 days (60+ dpd). Efforts should be made to bring down the norm of the delinquency level to 30+ dpd, to improve the hygiene of loan assets.
Guardrail 8: The MFIs should move towards making PAN Card as the first ID for KYC and Credit bureau reporting. An aspirational level of 30% coverage through PAN may be attempted within a year time.
Guardrail 9: The end use of loans to be verified to ensure proper utilization of loans.
Guardrail 10: Do a mandatory employee bureau check before hiring. Any staff hired from the microfinance industry should only be given three months’ time to produce a relieving letter. The lending institutions should also not withhold the relieving letter of any staff member without a justifiable reason.
Conclusion
NBFC-MFIs have emerged as a critical pillar in expanding financial inclusion, particularly for rural and women borrowers. Their outreach has expanded with increased geographical coverage, expanded branch networks, and significant client growth. However, FY2025-26 highlighted stress in portfolio quality, with rising PAR levels and substantial write-offs, reflecting heightened credit risk. Despite strong disbursement volumes and increasing asset size, sustainability remains challenged by high operating costs, staff attrition, and pricing pressures. In the future, balancing growth with prudent risk management and ensuring affordable credit will be vital for strengthening resilience and maintaining their role in inclusive financial development.
Overall, NBFC-MFIs continued to demonstrate strong scale and outreach, with Very Large institutions accounting for the majority of portfolio, clients, staff and disbursements. The sector maintained a largely stable branch network and expanded into new states. Larger institutions benefited from lower funding and operating costs, supporting relatively lower interest rates and highlighting the benefits of scale and operational efficiency.