


Chapter 2 Section 2.5Disbursement Overview
Total loan amount disbursed declined to ₹2,49,034 Cr. in FY 2025-26 from ₹2,71,106 Cr. in FY 2024-25, a decrease of 8%.


Number of Loans Disbursed (in lakhs) across micro-lenders
Amount Disbursed (in ₹ Cr.) by Micro-Lender
2.5 Disbursement Overview
2.5.1 Disbursement Volume (Number of loans disbursed)
Figure 2.9 indicates the number of loans disbursed by all the micro-lenders during FY 2025-26, compared with the previous financial year. The data reveals a significant decline in loan disbursements, dropping from 532 lakh loans in FY 2024-25 to 419 lakh loans in FY 2025-26, representing a year-on-year decrease of 21%.
Figure 2.9: Number of Loans Disbursed (in lakhs) across micro-lenders
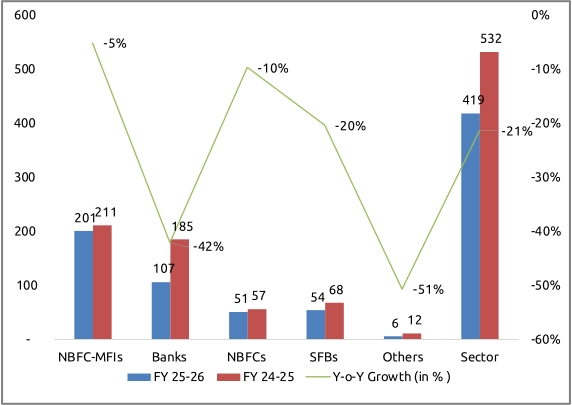
During the financial year 2025-26, the micro-lenders disbursed a total of 419 lakh loans. NBFC-MFIs led the disbursement with 201 lakh loans, constituting 48% of the total. Banks followed the NBFC-MFIs disbursing 107 lakh loans and accounting for 26% of the total. Other category of lenders contributed a minimal share of 1%.
All categories of micro-lenders experienced negative year-on-year growth in the number of loans disbursed during FY 2025-26. The steepest decline was observed in the ‘Others’ category with a (-51%) reduction, followed by Banks at (-42%), SFBs at (-20%), NBFCs at (-10%), and NBFC-MFIs at (-5%), respectively. This overall decrease in loan disbursement volume was primarily driven by a liquidity crunch and a cautious lending approach emphasising risk management after a phase of rapid expansion and rising defaults.
2.5.2 Loan Amount Disbursed (in ₹ Cr.)
During FY 2025-26, the total loan amount disbursed by all the micro-lenders together declined to ₹2,49,034 Cr., compared to ₹2,71,106 Cr. in FY 2024-25, marking a year-on-year decrease of (-8%). However, the last quarter (Q4 FY 26) saw a turnaround, recording a disbursement of ₹78,182 Cr. as against ₹66,259 Cr. in the corresponding quarter of the previous year (Q4 FY 25), indicating that the sector has started showing signs of revival. The State- and Union Territory-wise disbursement figures for FY 2025-26 are detailed in Table 2.14.
Table 2.14 Loan Amount Disbursed (in ₹ Cr.) of all micro-lenders across States/UTs during FY 2025-26 and FY 2024-25 (in descending order of Loan Amount Disbursed)
| Sl. No. | State/UT | During FY 2025-26 (in ₹ Cr.) |
During FY 2024-25 (in ₹ Cr.) |
Y-o-Y Growth (in %) |
|---|---|---|---|---|
| 1 | Bihar | 41,599 | 43,907 | -5% |
| 2 | Uttar Pradesh | 31,611 | 31,755 | -0.5% |
| 3 | Tamil Nadu | 28,315 | 30,505 | -7% |
| 4 | West Bengal | 23,164 | 26,814 | -14% |
| 5 | Karnataka | 20,980 | 24,911 | -16% |
| 6 | Maharashtra | 17,329 | 21,303 | -19% |
| 7 | Madhya Pradesh | 14,753 | 15,686 | -6% |
| 8 | Odisha | 12,004 | 13,831 | -13% |
| 9 | Rajasthan | 10,083 | 10,316 | -2% |
| 10 | Jharkhand | 8,771 | 8,738 | 0.4% |
| 11 | Gujarat | 6,620 | 7,101 | -7% |
| 12 | Assam | 5,369 | 4,422 | 21% |
| 13 | Keralam | 5,214 | 6,258 | -17% |
| 14 | Chhattisgarh | 4,461 | 4,876 | -9% |
| 15 | Andhra Pradesh | 4,358 | 5,128 | -15% |
| 16 | Punjab | 3,545 | 2,842 | 25% |
| 17 | Haryana | 3,520 | 3,364 | 5% |
| 18 | Telangana | 3,225 | 4,780 | -33% |
| 19 | Tripura | 1,222 | 1,459 | -16% |
| 20 | Uttarakhand | 1,055 | 1,208 | -13% |
| 21 | Puducherry | 646 | 711 | -9% |
| 22 | Delhi | 382 | 385 | -1% |
| 23 | Himachal Pradesh | 144 | 143 | 1% |
| 24 | Meghalaya | 144 | 112 | 29% |
| 25 | Arunachal Pradesh | 119 | 96 | 25% |
| 26 | Mizoram | 83 | 71 | 17% |
| 27 | Goa | 69 | 107 | -36% |
| 28 | Nagaland | 67 | 53 | 26% |
| 29 | Jammu & Kashmir | 53 | 70 | -24% |
| 30 | Sikkim | 50 | 70 | -28% |
| 31 | Others | 26 | 28 | -7% |
| 32 | Chandigarh | 22 | 21 | 3% |
| 33 | Manipur | 14 | 17 | -15% |
| 34 | Andaman & Nicobar Islands | 13 | 15 | -14% |
| 35 | Dadra and Nagar Haveli and Daman and Diu | 5 | 5 | -2% |
| 36 | Lakshadweep | 0.006 | 0.005 | 25% |
| Sector | 2,49,034 | 2,71,106 | -8% |
The top 5 states in terms of loan amount disbursed during FY 2025-26 were Bihar (₹41,599 Cr.), followed by Uttar Pradesh (₹31,611 Cr.), Tamil Nadu (₹28,315 Cr.), West Bengal (₹23,164 Cr.), and Karnataka (₹20,980 Cr.). Collectively, these 5 states accounted for 58% of the total amount disbursed by all the micro-lenders during the year.
Figure 2.10: Share of Loan Amount Disbursed (in ₹ Cr.)
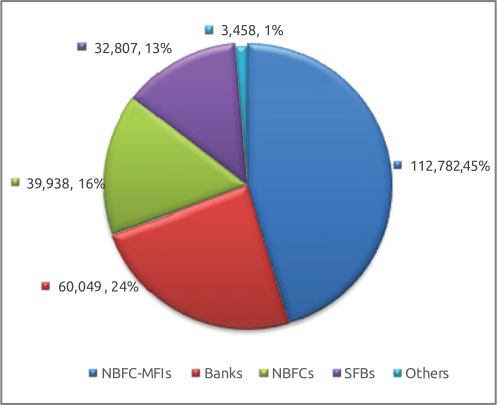
The combined micro-credit disbursements of all micro-lenders during FY 2025-26 were at ₹2,49,034 Cr., with the NBFC-MFIs having disbursed ₹1,12,782 Cr., followed by Banks (₹60,049 Cr.), NBFCs (₹39,938 Cr.), SFBs (₹32,807 Cr.), while Others disbursed only ₹3,458 Cr.
Figure 2.11: Area-wise segregation of Amount Disbursed (in ₹ Cr.)
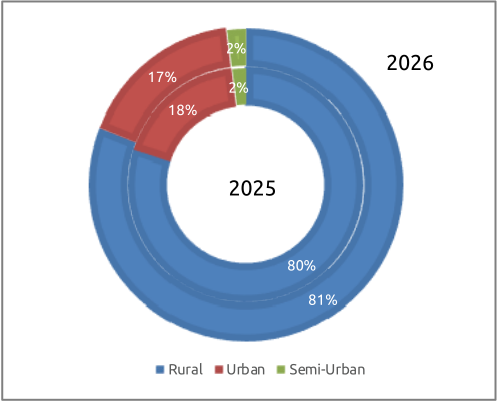
As depicted in Figure 2.11, the disbursement pattern during FY 2025-26 reflects a pronounced rural orientation, with rural areas accounting for 81% of total disbursements, while urban and semi-urban segments contributed 17% and 2%, respectively. A broadly consistent pattern was observed in the preceding year, FY 2024-25, wherein rural disbursements constituted 80% of cumulative disbursements, followed by urban disbursements at 18% and semi-urban disbursements at 2%.
This sustained and consistent trend across both financial years underscores that microfinance continues to remain predominantly a rural-centric phenomenon, reaffirming its foundational role in advancing financial inclusion for underserved and credit-deficient populations residing in rural geographies. The marginal year-on-year increase in the rural share (from 80% to 81%) further indicates a deepening penetration of micro-lenders in rural markets, reflecting the sector’s continued alignment with its core developmental mandate of extending affordable credit to the last mile.
2.5.3 Aspirational Districts - Disbursement
Table 2.15 Amount Disbursed (in ₹ Cr.) in Aspirational Districts by Micro Lender Type (During FY 2025-26 and FY 2024-25)
| Micro Lender | March 2026 | March 2025 | Micro Lender Share (in %) | Y-o-Y Growth (in %) |
|---|---|---|---|---|
| NBFC-MFIs | 19,142 | 16,926 | 49% | 13% |
| Banks | 9,834 | 14,735 | 25% | -33% |
| NBFCs | 5,663 | 4,736 | 14% | 20% |
| SFBs | 4,085 | 4,644 | 10% | -12% |
| Others | 423 | 722 | 1% | -41% |
| Overall | 39,147 | 41,763 | -6% |
Disbursements to these districts also moderated, falling by (-6%) from ₹41,763 Cr. in FY 2024-25 to ₹39,147 Cr. in FY 2025-26. Among the micro-lenders, NBFC-MFIs have the maximum share of disbursements of 49% in aspirational districts, followed by Banks at 25%, NBFCs at 14%, SFBs at 10% and Others at 1%, respectively.