


Chapter 1.6What Helped, and What Did Not: A Causal Reading of the Cycle
Of everything that happened between FY2022-23 and FY2025-26, what actually made the difference, and in which direction? The answer requires causal discipline rather than chronology, because the cycle had many features and only some of them were causes.


Indian Microfinance: Resilience, Responsibility & Inclusion Ramesh Srivatsava Arunachalam
1.6 What Helped, and What Did Not: A Causal Reading of the Cycle
The introduction set out the framework; the preceding sections applied it to the macroeconomic record. This section uses both to answer the question a sector publication exists to answer: of everything that happened between FY2022-23 and FY2025-26, what actually made the difference, and in which direction? The answer requires causal discipline rather than chronology, because the cycle had many features and only some of them were causes. Diagram 1 sets out the full chain.
DIAGRAM 1
The causal chain of the FY2024-26 microfinance cycle
Root Cause
- Household repayment capacity is a thin residual
- Sensitive to any movement in income, prices, obligation or shocks
Contributing Factors
- Rapid post-pandemic expansion
- Obligation building across lenders
- Information slower than circumstances
Triggers
- Food and rural inflation
- Uneven farm income
- External and climate shocks
- Local disruption to collections
Mechanisms
- Missed instalments
- PAR 30+, 2.1% → 6.2%
- Lender caution
- Borrowings ₹1.30 trillion → ₹0.86 trillion
- Disbursement falls
Consequences
- Household: access tightened
- Institutional: margin 9.49% → 7.99%
- OSS 122 → 104
- System: contained
What Changed the Course
- Household-level regulation, 2022
- Industry guardrails 2024 and 2025
- Favourable macro configuration
- Credit guarantee architecture, 2026
- Qualifying asset flexibility
The root cause was structural and long predates the cycle: household repayment capacity in this segment is a thin residual. When income is modest, essential expenditure is large and non-discretionary, and buffers are shallow, the surplus available for debt service is small in absolute terms and highly sensitive to movement in any of the other three terms of the identity. That is a permanent feature of lending to this segment, not a defect of any institution’s underwriting. The contributing factors were three, and they compounded: the rapid post-pandemic expansion, with the portfolio rising from approximately ₹2.90 trillion in 2022 to ₹3.52 trillion in 2023 and ₹4.15 trillion in 2024;41 the accumulation of household obligation across multiple lenders that accompanied it, since a household’s total obligation was visible to no single lender in full; and the incompleteness of the information architecture, with bureau reporting cycles measured in weeks against borrower circumstances that change in days, and self-help group borrowing recorded in a system entirely separate from institutional borrowing.
The triggers were macroeconomic and arrived from outside the sector — food inflation through FY2023-24 and into FY2024-25, uneven rural income conditions, and local disruptions that interrupted collection cycles. The mechanisms then propagated the shock in a traceable sequence. Compressed household surplus produced missed instalments; missed instalments produced rising portfolio at risk, moving beyond 30 days from 2.1 to 6.2 per cent and beyond 90 days from 1.6 to 4.8 per cent;42 rising portfolio at risk produced caution among the banks that fund microfinance institutions; that caution produced the funding contraction, with outstanding borrowings of micro lending institutions falling from ₹1.30 trillion to ₹859 billion, a decline of approximately a third; and the funding contraction produced reduced disbursement, which reduced portfolio, which compressed institutional economics further. Figure 1.7 shows where that shock landed.
Figure 1.7: Where the macro shock landed on the balance sheet43
(Funding and unit economics of micro lending institutions, FY2023-24 to FY2024-25)
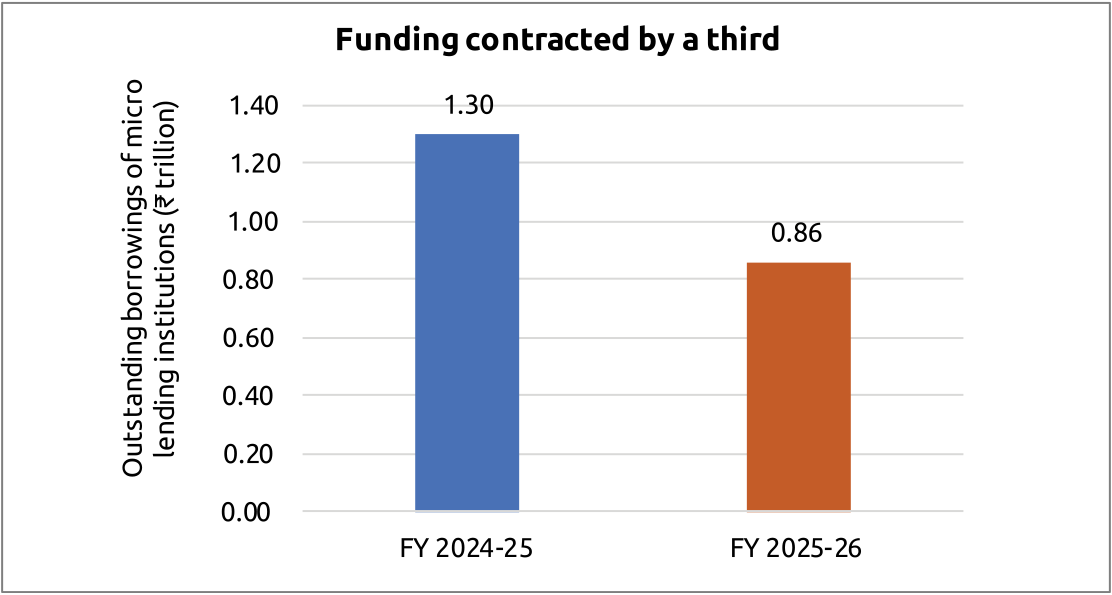
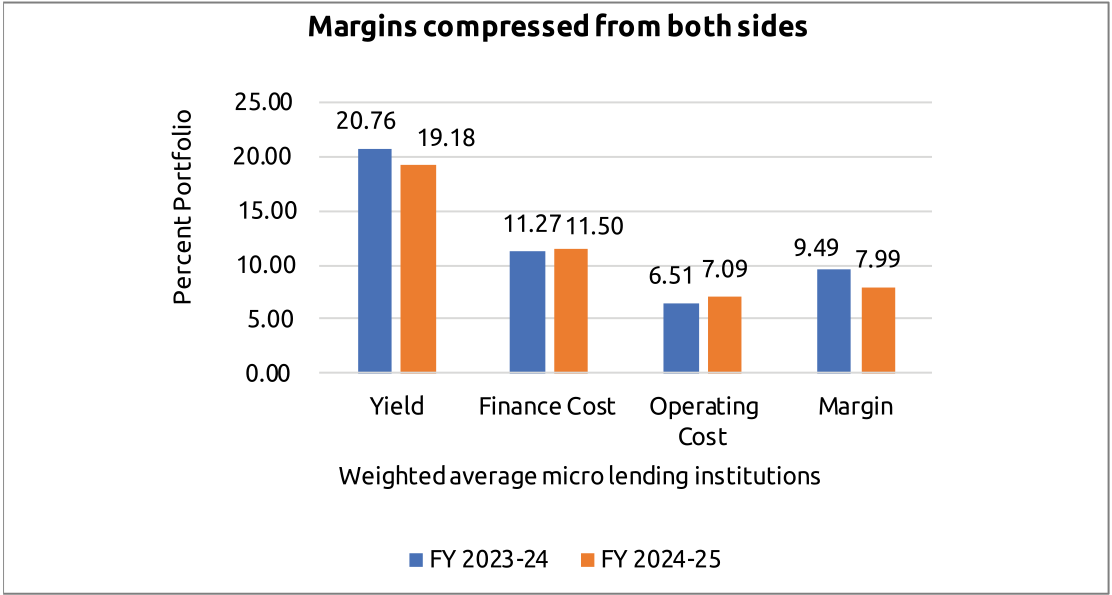
Operational self-sufficiency fell from 122 to 104 per cent as yield fell and both cost lines rose. The consequences were felt at three levels. At household level, credit availability tightened, and some households moved to other instruments. At institutional level the squeeze was severe and asymmetric: yield fell from 20.76 to 19.18 per cent while finance cost rose from 11.27 to 11.50 per cent and operating cost from 6.51 to 7.09 per cent, so that margin compressed from 9.49 to 7.99 per cent, operational self-sufficiency fell from 122 to 104 per cent, and return on assets moved from 4.06 per cent to −1.71 per cent.44 At system level the effect was contained, which is itself the most important finding: at no point did the sector’s difficulties threaten financial stability. Table 1.6 sets the chain out in summary.
Table 1.6: Causal structure of the FY2024-26 microfinance cycle
| Causal layer | What it was | Evidence |
|---|---|---|
| Root cause | Household repayment capacity is a thin residual, highly sensitive to movement in income, prices, obligations, or shocks | The surplus identity; expenditure share on food in low-income budgets |
| Contributing factor | Rapid post-pandemic portfolio expansion | Portfolio ₹2.90 trillion (2022) → ₹3.52 trillion (2023) → ₹4.15 trillion (2024) |
| Contributing factor | Household obligation accumulating across lenders, invisible to any one of them | Borrowers with five or more lenders at 2.8 per cent in March 2024 |
| Contributing factor | Information architecture slower than borrower circumstances | Reporting cycles in weeks; SHG borrowing outside the institutional record |
| Trigger | Food inflation compressing household surplus; uneven rural income; local disruptions | The fastest transmission channel, operating with no lag |
| Mechanism | Missed instalments → portfolio at risk → lender caution → funding contraction → reduced disbursement | PAR 30+, 2.1% → 6.2%; borrowings ₹1.30 trillion → ₹859 billion |
| Consequence, household | Credit availability tightened; substitution towards other instruments | Client base down 13 per cent in FY2024-25; gold-backed lending compounding rapidly |
| Consequence, institutional | Severe margin compression | Margin 9.49% → 7.99%; OSS 122% → 104%; RoA 4.06% → −1.71% |
| Consequence, system | Contained; no threat to financial stability | Banking system gross non-performing assets at multi-decadal lows throughout |
Naming the chain is only half the exercise; the key question is which interventions changed it. Five interventions made a measurable positive difference. Household-level regulation had the strongest structural impact, particularly the 2022 shift from product- to household-based assessment. Industry guardrails also worked: borrowers with two or fewer lenders increased from 90.5% to 92.6%, while those with five or more fell from 1.6% to 0.1%. The supportive macroeconomic environment, credit guarantees and regulatory flexibility on qualifying assets also strengthened sector stability.
However, three gaps remained. Information systems still do not provide a complete household-level view, particularly for SHG borrowing. Institutional support was uneven, with NBFC-MFIs receiving most of the funding. Household resilience products—insurance, savings and pensions also lagged behind the expansion of credit. The broader lesson is that Indian microfinance has developed a functioning corrective mechanism. Household leverage rose, regulation and industry guardrails responded, multiple lending declined, asset quality recovered, and growth resumed without systemic disruption. This corrective capacity—not any single March 2026 indicator is the sector’s most important asset for the next decade