


Chapter 4 - Section 4.3Income and Expenditure Analysis
The income and expenditure analysis of the microfinance sector for FY 2026 indicates a decline compared to previous years, against the backdrop of a recalibration driven by prolonged stress in the sector. As reported in Chapter 2, the microfinance industry recorded an 11% year-on-year fall in total loan outstanding, mostly due to banks and SFBs taking a very cautious approach and running down the portfolio. NBFC-MFIs, which account for the bulk of Sa-Dhan’s membership, were nearly flat, with a slight degrowth of -1%.


Chapter 4 Section III
Income and Expenditure Analysis
The income and expenditure analysis of the microfinance sector for FY 2026 indicates a decline compared to previous years, against the backdrop of a recalibration driven by prolonged stress in the sector. As reported in Chapter 2, the microfinance industry recorded an 11% year-on-year fall in total loan outstanding, mostly due to banks and SFBs taking a very cautious approach and running down the portfolio. NBFC-MFIs, which account for the bulk of Sa-Dhan’s membership, were nearly flat, with a slight degrowth of -1%.
Asset quality improved significantly over the same period: sector-wide PAR 30-179 DPD fell from 6.63% to 2.34%, and MLI-level PAR>30 eased from 7.52% to 5.75%, though the improvement was concentrated more at the larger end of the sector than the smaller. Against this improving but uneven picture, operating costs rose sharply to 8.47% in FY2025-26 from 7.09% the year before, even as total income held essentially flat at ₹36,191 crore. This is notable because it did not happen against an inflationary backdrop (the RBI projected FY2025-26 retail inflation at just 2.1%1, comfortably within its tolerance band for most of the year), which means the sector’s rising cost ratio is being driven by its own operating choices rather than by broader price pressure in the economy. A workforce that contracted 13% did not translate into a lighter wage bill either: personnel expenses climbed from 21.6% to 26.5% of total costs, suggesting the sector is paying more per employee even as it employs fewer.
Three threads run through this year’s cost structure. First, the sector lent differently: loan accounts fell 21% even as average ticket size rose 17% to ₹59,473, pointing to fewer but larger and more carefully underwritten loans, a shift that typically raises per-loan servicing and compliance costs even as it improves portfolio quality. It is also a meaningfully larger loan relative to the rural income borrowers draw on, at a time when farm-gate price growth has been unusually soft, which makes careful underwriting at this ticket size more important than ever. Second, the cost of stabilisation itself shows up directly: intensified collections on a still-recovering book, retention spending in a year of continued high attrition, and ongoing investment in digital and AI-enabled tools all tend to raise costs before their benefits are fully realised. Third, financial expenses tell a more encouraging story than operating costs: the finance cost ratio eased to 10.9% from 11.5% on a consistent weighted-average basis, a moderation that lines up with the RBI’s own easing cycle through late 2025 and early 2026, suggesting the sector’s cost of borrowed funds genuinely improved even as operating and personnel costs rose. The one figure worth reading with some caution is the size-wise breakdown of operating cost, where last year’s “>₹2,000 crore” bucket was split into two narrower categories this year, making a direct year-on-year comparison at that level less than exact. Taken together, the numbers describe a sector absorbing the near-term operating cost of a broader correction, pulling back from higher-risk lending, tightening underwriting, and holding onto scarcer staff, even as its cost of funds moved in the right direction on the back of a friendlier monetary policy backdrop.
1 https://www.mospi.gov.in/uploads/latestReleases/latest_release_1767781372753_1380ce82-f5a5-440d-99e6-e6b35af0deb5_GDP_Press_Note_on_FAE_2025-26.pdf ; https://ddnews.gov.in/en/rbi-projects-inflation-at-2-1-in-fy26-revises-fy27-growth-outlook-upward/
4.3.1 Expenditure Analysis
Operating costs are a key determinant of the efficiency, competitiveness and financial sustainability of microfinance institutions. Given the sector’s field-intensive operating model, institutions incur high costs in mobilising funds, maintaining a workforce, managing branches and delivering services to borrowers, particularly across rural and underserved markets. The composition of operating expenses therefore provides useful insight into the major cost drivers and the efficiency of institutional operations. In an environment characterised by slower portfolio growth, greater emphasis on responsible lending, and increasing adoption of digital technologies, effective cost management has become more important. At the same time, cost optimisation must be balanced with adequate investment in human resources, technology, risk management, customer service, and borrower protection — all of which ultimately determine how affordably and sustainably the sector can keep extending credit to borrowers who remain outside the reach of mainstream banking. The following analysis examines the distribution of major expense categories and highlights the relative contribution of financial, personnel, administrative, and other expenses to the sector’s overall cost structure.
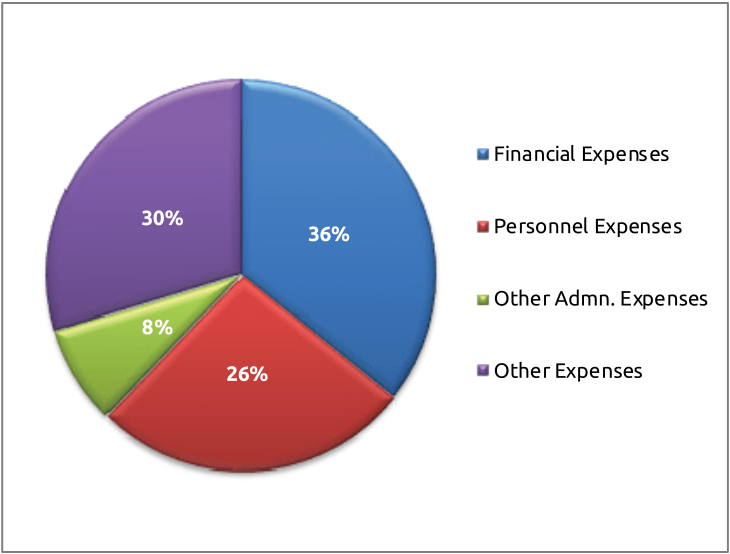
Figure 4.3.1: Breakdown of expenses under various categories by MLIs2
2 Personnel Expenses include salary & wages, including incentive expenses; Other Admin Expenses include expenses incurred on travel, admin, training, and depreciation; Other Expenses include Loan Loss Provision expenses and any other expenses.
The cost structure of microfinance institutions indicates a significant allocation towards financial and operational expenses, reflecting the cost-intensive nature of delivering financial services to underserved and geographically dispersed borrowers. Financial expenses account for the largest share at 36%, followed by other expenses at 30% and personnel expenses at 26%. The remaining 8% is attributable to other admin expenses. Together, financial and other expenses constitute 68%. Here it may be noted that a significant share of the other expenses includes Loan Loss Provision Expenses. Personnel expenses, at over one-fourth of total costs, also underline the continued importance of a field-oriented workforce for customer engagement, credit assessment and portfolio management. The relatively small share of other expenses suggests that the major cost drivers remain the cost of funds, employee-related expenditure and core administrative operations. In the current environment of slower portfolio growth and greater emphasis on efficiency, managing these costs while maintaining service quality and responsible lending practices will be important for the sector’s long-term sustainability.
The higher share of administrative cost is not a very encouraging aspect. The MLIs need to work on this through efficiency in operation, by adopting technology etc and there should be an effort to bring it down so that the ultimate cost will be reduced and the borrowers can be benefitted to that extent.
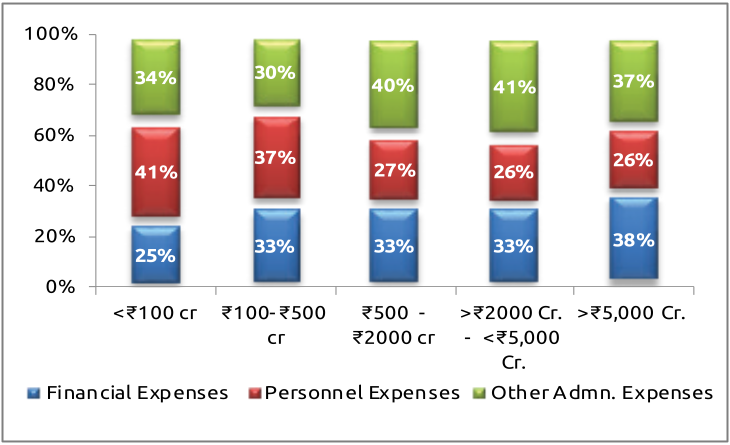
Figure 4.3.2: Break up of expenses by MLIs based on legal form and portfolio size
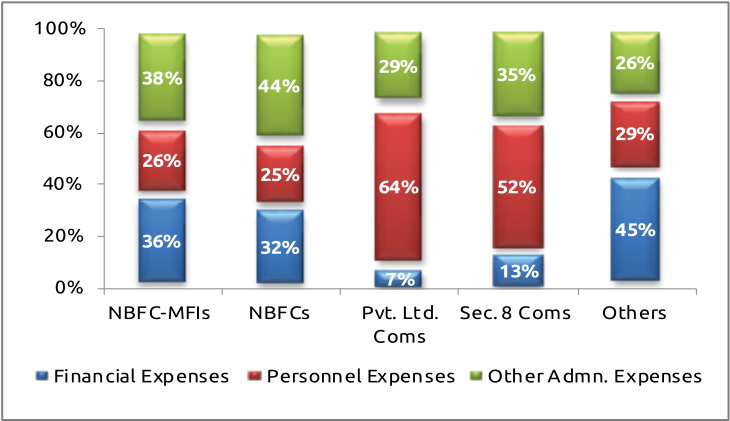
The cost structure varies considerably across legal forms and institutional size, reflecting differences in business models, scale and operating intensity. Among legal forms, NBFC-MFIs have a relatively balanced cost structure, with financial expenses accounting for 36%, personnel expenses 26% and other administrative expenses 38%. NBFCs show a similar pattern, although administrative expenses are higher at 44%. In contrast, Private Limited Companies have a markedly higher share of personnel expenses at 64%, while financial expenses account for only 7% because their financial cost is only for funds needed to meet working capital. Sec. 8 companies also have a relatively high personnel cost share of 52%.
Across institution sizes, the cost structure appears more consistent. Smaller institutions with portfolios below ₹100 crore have the highest personnel expense share at 41%, compared with 25% for financial expenses and 34% for administration. As institutional size increases, the personnel cost component declines, reaching 26% among institutions in the ₹2,000–5,000 crore range, while administrative expenses rise to 41%. Financial expenses remain relatively unchanged at around 33% among institutions above ₹100 crore. Overall, the data suggest that larger institutions benefit from greater scale in personnel deployment, while smaller institutions face relatively higher staff-related costs. The increasing administrative cost share among larger institutions may reflect greater investment in technology, compliance, risk management and institutional infrastructure required to manage larger portfolios.
4.3.1.i Operating Cost3
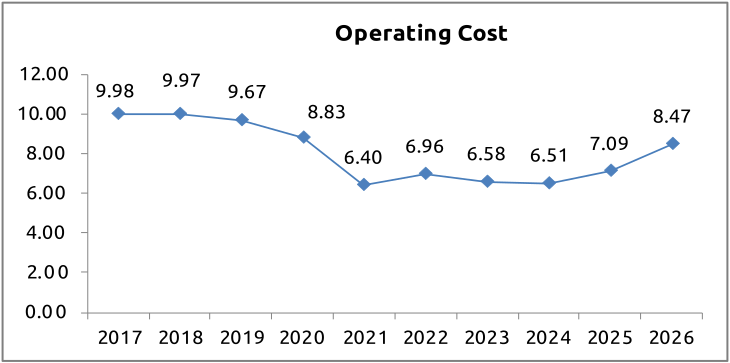
The operating expense ratio is an important measure of the sector’s cost efficiency, indicating operating expenses relative to the scale of business operations. Tracking this ratio over time helps assess changes in institutional efficiency, cost pressures, and microfinance institutions’ ability to manage expenses amid evolving portfolio and operational conditions. The operating cost ratio remained relatively high during 2017–20, declining from 9.98% in 2017 to 8.83% in 2019 before falling sharply to 6.40% in 2021. It remained broadly stable at around 6.5–7.0% during 2022–24, indicating improved cost efficiency. However, the ratio increased to 7.09% in 2025 and further to 8.47% in 2026, signalling renewed operating cost pressures. The 2026 increase may reflect higher staff intensity, investments in compliance and risk management, portfolio-quality management, and slower portfolio growth, which can raise the cost ratio as operating expenses are spread over a slower-growing business base. This rise occurred in a year of unusually benign national consumer-price inflation, reinforcing that it is a sector-specific, structural cost increase rather than one imported from the wider economy. While the ratio remains below the levels observed in 2017–20, the recent upward movement highlights the importance of cost optimisation and productivity improvements for maintaining operational and financial sustainability.
3 Define as (Personnel Cost including incentive + Travel Cost + Admin Cost + Group Dev. Cost/Training Cost + Depreciation + Any Others)/Average Portfolio Outstanding.
Figure 4.3.3: Trends of Operating Cost across MLI Categories4
4 Based on weighted average for all MLIs.
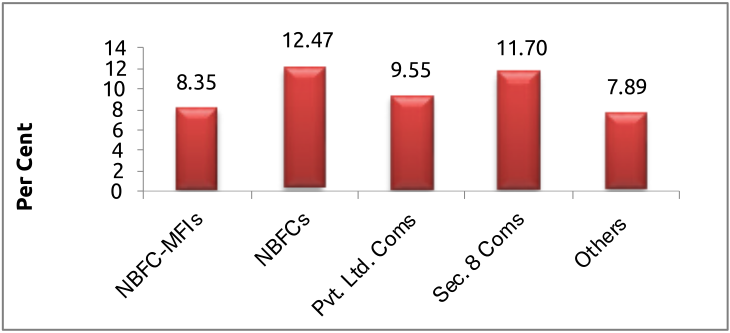
The cost ratio varies considerably across both legal forms and institutional size. By legal form, NBFCs record the highest ratio at 12.47%, followed by Section 8 companies at 11.70% and Private Limited Companies at 9.55%. NBFC-MFIs record a ratio of 8.35%, while Other institutions have the lowest ratio at 7.89%. The relatively higher ratios among NBFCs and Section 8 companies indicate greater operating cost intensity, while the lower ratios among NBFC-MFIs and other institutions suggest comparatively lower operating costs relative to their operating income.
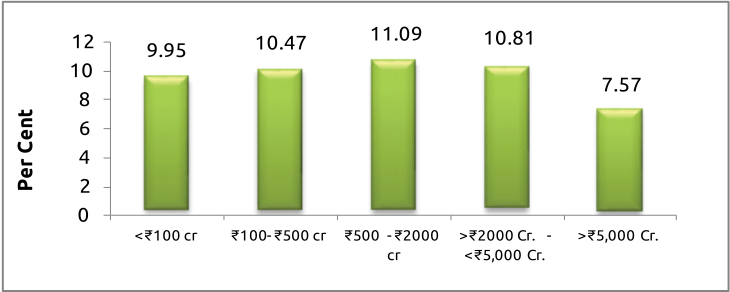
Across portfolio size, the cost ratio generally increases with institutional size up to the ₹500–2,000 crore category, before declining among larger institutions. Institutions with a portfolio below ₹100 crore record a ratio of 9.95%, which rises to 10.47% for those in the ₹100–500 crore range and peaks at 11.09% among institutions with ₹500–2,000 crore portfolios. The ratio then moderates to 10.81% for institutions in the ₹2,000–5,000 crore category and declines substantially to 7.57% among the largest institutions with portfolios above ₹5,000 crore. The substantially lower ratio among the largest institutions points to the benefits of scale, with operating and administrative costs being spread across a larger portfolio. Overall, the distribution highlights the role of scale and cost optimisation in improving operating efficiency, particularly as institutions expand their portfolio.
4.3.1.ii Finance Cost5
Finance cost is a key component of microfinance institutions’ overall cost structure and directly affects their financial sustainability, pricing, and profitability. Given the sector’s dependence on external borrowings and institutional funding, movements in the cost of funds can significantly affect operating margins and lenders’ ability to maintain affordable, sustainable credit. Tracking the finance cost ratio over time indicates changes in funding conditions, borrowing patterns, interest rates, and liability management, and offers a direct read on how faithfully the RBI’s monetary policy cycle is transmitted to the last-mile borrower. The trend also helps assess how institutions have responded to changing market conditions while balancing the need for adequate funding with cost efficiency.
5 Define as the Total expense incurred for acquiring funds /Average Outstanding Borrowings.
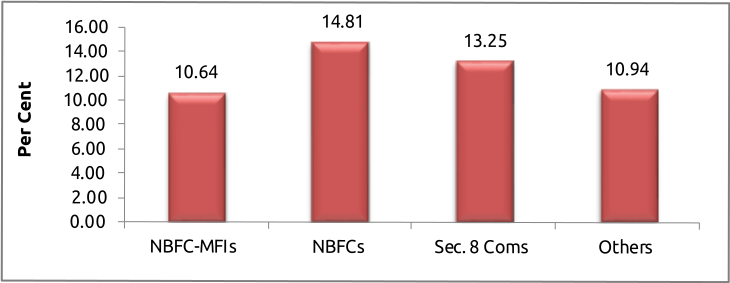
Figure 4.3.4: Trends of Finance Cost across MLI Categories6
6 Based on weighted average of all MLIs.
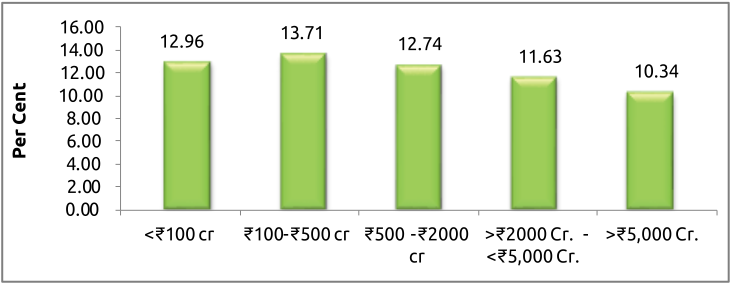
The finance cost shows a clear relationship with institutional scale, with larger institutions generally recording markedly lower funding costs. By portfolio size, finance cost is highest for institutions in the ₹100–500 crore category at 13.71%, followed by those below ₹100 crore at 12.96% and the ₹500–2,000 crore segment at 12.74%. It declines to 11.63% among institutions in the ₹2,000–5,000 crore range and falls to 10.34% for institutions above ₹5,000 crore. This pattern suggests that larger institutions may benefit from better access to diversified, relatively lower-cost funding, stronger credit profiles, and economies of scale in fund mobilisation.
Across legal forms, NBFCs record the highest finance cost at 14.81%, followed by Sec. 8 companies at 13.25% and Other institutions at 10.94%. NBFC-MFIs report a comparatively lower finance cost of 10.64%, despite being the dominant institutional category. The variation may reflect differences in funding sources, access to bank and institutional finance, borrowing terms, creditworthiness and liability structures. In case of NBFC MFIs, the maximum borrowing is done by larger NBFC-MFIs, who generally able to access funds more economically. This could also be reason for an lower average cost of funds for NBFC-MFIs. The share of smaller MFIs which access funds generally at a higher cost, has been less during the year.
Overall, the data reinforce the importance of funding diversification and scale in managing finance costs, particularly for smaller institutions and entities with relatively limited access to low-cost institutional funding.
4.3.1.iii Trends of Operating Cost and Finance Cost
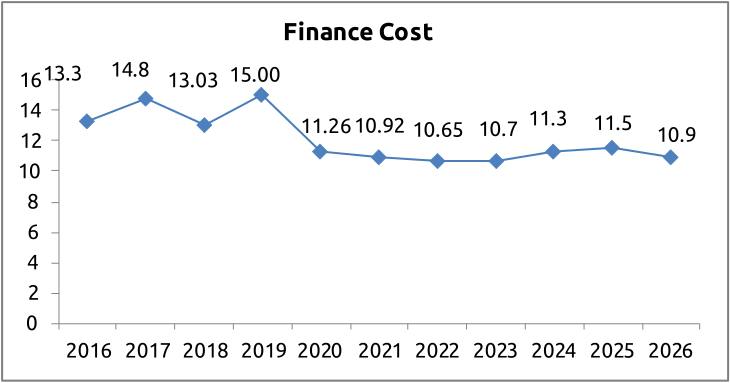
The combined movement of finance cost and operating cost provides a useful perspective on the microfinance sector’s evolving cost structure and sustainability. Finance cost declined substantially from the higher levels observed during 2016–19, when it ranged between 13.0% and 15.0%, to around 10.6–10.9% during 2021–23. Finance cost then increased to 11.5% in 2025 before moderating marginally to 10.9% in 2026 — a moderation that tracks closely with the RBI’s own rate actions, which cut the repo rate by 25 basis points in December 2025 and held it at 5.25% in February 2026 on the back of a softer inflation outlook7. That the sector’s own cost of funds eased only marginally despite this policy support suggests transmission remains incomplete, and that funding pressures continue to matter more for some institutions than the headline number implies.
Operating cost followed a different trajectory. It declined sharply from around 10% in 2017–18 to 6.4% in 2021, remaining broadly contained through 2024. However, it increased to 7.09% in 2025 and further to 8.47% in 2026 — even as the broader economy grew by an estimated 7.4% and inflation stayed low, underlining that this is a cost story written inside the sector rather than one imposed from outside it. This recent rise is particularly significant when viewed alongside the workforce trends discussed earlier. Staff strength declined in 2026, but the client-to-staff ratio also fell sharply to 210, suggesting that institutions are deploying greater staff intensity per client. Higher expenditure on collection of dues, compliance, risk management, borrower engagement and portfolio monitoring may also be contributing to the increase in operating costs.
Taken together, finance and operating costs amounted to approximately 19.4% in 2026, compared with around 18.6% in 2025 and 17.8% in 2024. Thus, despite lower finance costs, rising operating costs have pushed the overall cost burden upward — and they have done so even as the RBI’s own easing cycle was working in the sector’s favour on the funding side, which means the net increase in the all-in cost ratio is, if anything, an understatement of how much operating costs alone have risen. This has important implications for the sector: with portfolio growth moderating and credit-quality pressures persisting, institutions may have less scope to absorb rising costs without affecting margins. At the same time, the higher operating intensity may support better underwriting, collections and borrower protection.
The key challenge for the sector is therefore not simply cost reduction, but achieving productivity-led efficiency, leveraging technology and scale to contain costs while preserving adequate investment in frontline staff, risk management and responsible lending. This is also the space in which the RBI’s principles-based pricing framework for microfinance loans8 operates: institutions set interest rates through a board-approved policy rather than a prescribed cap, which means cost discipline, and not regulation alone, is what will ultimately determine how much of the current cost pressure gets passed on to borrowers. The substantially lower cost ratios among the largest institutions further indicate the potential benefits of scale and funding diversification, while smaller and mid-sized institutions may face greater pressure to improve operational efficiency and access more competitive funding.
7 Reserve Bank of India, Monetary Policy Committee statements, December 2025 and February 2026 (repo rate held at 5.25% in February 2026 following a 25-bps cut in December 2025). See “India Holds Rates, Revises Up FY25/26 GDP Forecasts,” Trading Economics, 6 February 2026. https://tradingeconomics.com/india/interest-rate/news/523674
8 Reserve Bank of India, Master Direction – Reserve Bank of India (Regulatory Framework for Microfinance Loans) Directions, 2022 (effective 1 April 2022, as updated), which requires regulated entities to price microfinance loans under a board-approved policy rather than a prescribed interest-rate cap. https://rbidocs.rbi.org.in/rdocs/notification/PDFs/89MDCD45D92E34D84C2695DF6977E4298BFF.PDFnews/523674
4.3.2 Income Analysis
The income structure of microfinance institutions provides an important indication of the strength and sustainability of their core business model, as well as the extent to which institutions are developing complementary revenue sources. While interest income from lending remains central to the sector, institutions are increasingly engaging in activities such as portfolio securitisation, fee-based services, business correspondent arrangements and third-party product distribution. Examining the composition of income helps assess the sector’s dependence on lending income, the degree of revenue diversification, and its potential resilience to changes in portfolio growth, interest rates, and funding costs — resilience that matters more in a year when the RBI’s own monetary cycle has been moving, since a portfolio dominated by interest income is, by construction, more exposed to swings in the wider rate environment than one with a meaningful share of fee-based or non-lending revenue.
The income structure of microfinance institutions remains strongly concentrated in interest income from the loan portfolio, which accounts for 80% of total income. This highlights the sector’s continued dependence on core lending as its primary revenue source. Portfolio sale and securitisation contribute 5%, while investment income accounts for 2%. Other revenue streams, including processing fees (3%), other fees and charges (2%), BC agreements (3%), third-party product sales (0.3%) and other sources (5%), together account for a relatively modest share.
Figure 4.3.5: Break-up of Income
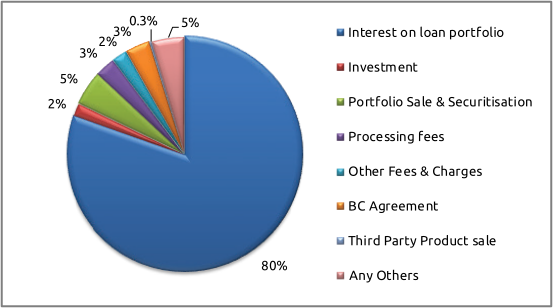
The composition indicates that while institutions are developing supplementary revenue streams, lending remains the dominant business model. Diversification through securitisation, fee-based services, BC arrangements, and third-party products can provide additional income and support liquidity and capital management. However, heavy reliance on interest income also means portfolio growth, repayment performance, pricing, and cost of funds remain critical determinants of institutional financial performance. In the current environment of moderated portfolio growth and heightened focus on responsible lending, developing sustainable non-interest revenue streams could become increasingly relevant for improving income resilience without relying solely on loan portfolio expansion.
4.3.2.i Yield on Loan Portfolio
Portfolio yield is an important indicator of the revenue-generating capacity of the microfinance portfolio and provides insight into the relationship between lending operations, pricing and institutional sustainability. It reflects the income generated from the loan portfolio and is influenced by factors such as interest rates, portfolio composition, borrower repayment patterns and changes in lending practices. Tracking portfolio yield over time helps assess how the sector has responded to changing market conditions, regulatory developments and the growing emphasis on responsible lending.
Figure 4.3.6: Yield Trend of MLIs
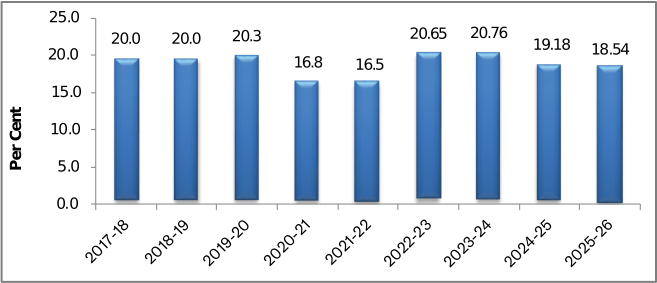
The trend indicates that the yield/return from the microfinance portfolio remained relatively stable at around 20% during 2017–20, before declining sharply during the pandemic period to 16.8% in 2020–21 and 16.5% in 2021–22. It recovered strongly thereafter, reaching 20.65% in 2022–23 and 20.76% in 2023–24. Since then, the ratio has moderated to 19.18% in 2024–25 and 18.54% in 2025–26. The recent decline of 64 basis points in 2025–26 suggests some moderation in portfolio yield, potentially reflecting changes in portfolio mix, pricing, competitive conditions and the increasing emphasis on responsible lending under the RBI’s principles-based pricing framework for microfinance loans, which requires institutions to set rates through a board-approved policy rather than a prescribed cap. Alongside rising operating costs and relatively stable finance costs, the lower yield could put pressure on institutional margins. However, the current level remains above the pandemic-period lows, indicating that the sector continues to generate a relatively stable return from its core lending portfolio.
Figure 4.3.7: Yield on Portfolio across MLIs
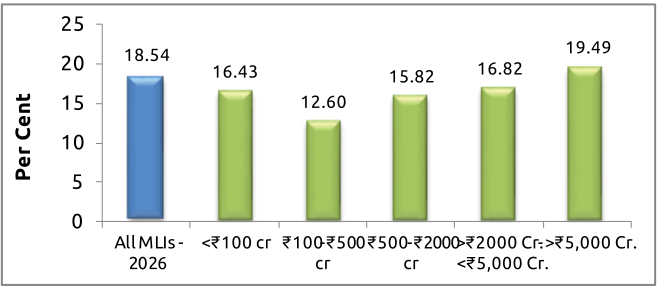
The 2026 portfolio yield shows a clear relationship with institutional scale, with larger institutions generally reporting higher yields. The overall yield stands at 18.54%, while institutions below ₹100 crore record 16.43% and those in the ₹100–500 crore category recorded the lowest yield of 12.60%. Yields then rise to 15.82% for ₹500–2,000 crore, 16.82% for ₹2,000–5,000 crore, and reach 19.49% for institutions above ₹5,000 crore. This variation may reflect differences in portfolio composition, pricing, product mix, and larger institutions’ ability to optimise portfolio deployment.
4.3.3 Margin
The comparison of portfolio yield and finance cost highlights a clear relationship between institutional scale and operating margins in 2026. The overall pattern suggests that larger institutions are better positioned to generate a positive spread between portfolio income and the cost of funds. Institutions with portfolios below ₹100 crore report a yield of 16.43% against a finance cost of 12.96%, resulting in a margin of 3.47 percentage points. The ₹100–500 crore segment records a negative margin of -1.11 percentage points, as its finance cost of 13.71% exceeds its portfolio yield of 12.60%. This indicates considerable pressure on financial sustainability for institutions in this segment even before operating and other administrative expenses are considered.
The margin improves to 3.08 percentage points for institutions in the ₹500–2,000 crore category and rises further to 5.19 percentage points among institutions in the ₹2,000–5,000 crore range. The strongest position is observed among institutions with portfolios above ₹5,000 crore, where a 19.49% yield and 10.34% finance cost generate a margin of 9.15 percentage points.
Figure 4.3.8: Yield, Cost and Margin of MLIs – size-wise based on weighted average values
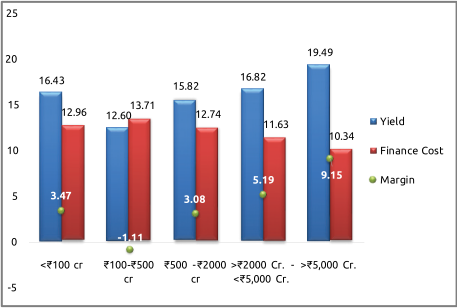
The data suggest that scale provides a significant advantage in managing funding costs and generating financial spread. Larger institutions may benefit from better access to diversified funding sources, stronger institutional credit profiles and greater bargaining power with lenders. Conversely, smaller and mid-sized institutions face greater vulnerability where relatively high funding costs coincide with lower portfolio yields.
Importantly, the margin shown here is not the final profit margin, as institutions must still meet operating, personnel, administrative and credit-loss expenses. Therefore, negative or narrow spreads in some segments indicate that these institutions have limited headroom to absorb operating costs, while larger institutions have greater capacity to absorb them and remain sustainable. This reinforces the importance of funding diversification, scale efficiencies, portfolio optimisation and operational productivity, particularly for smaller and mid-sized MFIs.
Conclusion
The analysis indicates that the microfinance sector is operating in an environment of moderating portfolio yields, rising operating costs and relatively stable finance costs. It is seen that the sector’s cost pressure is a structural, internally driven story — staff intensity, compliance, collections — rather than one the wider economy imposed on it, and it means the easing the sector did get, largely on the finance-cost side via the RBI’s own rate cuts, was only partly able to offset the rise in operating costs. While larger institutions benefit from economies of scale, lower funding costs and stronger financial spreads, smaller and mid-sized institutions face greater cost and margin pressures. The rise in operating costs, along with higher staff intensity, reflects greater emphasis on risk management, responsible lending, and borrower engagement. Going forward, cost efficiency, diversified funding, technology adoption and productivity improvements will be important for maintaining sustainable growth while preserving portfolio quality and borrower protection — particularly if the favourable funding environment does not extend evenly across the sector, or if the recent softness in inflation gives way to the upside pressures the RBI itself has flagged from energy prices and currency movements.
As microfinance loan pricing depends on funding and operating costs, MLIs need to rationalise and reduce costs, especially where they have control. In this context, operational and risk costs are important and need close monitoring. Ultimately, microfinance should benefit borrowers through better pricing, which remains a point of criticism.