


Chapter 4 - Section 4.2Asset Quality in MLIs
After a workforce that contracted for the first time in over a decade, even as ABS held steady, suggesting the leaner staff base didn’t come at the cost of coverage, asset quality tells a different recovery story. Portfolio At Risk beyond 30 days (PAR>30, including 180 +dpd) eased to 5.75% as on 31 March 2026 (in respect of the MLIs whose data was received) as against 7.52% at the end of FY2025-26. The improvement aligns with the trends documented in Chapter 4.I: a more field-heavy employee structure and stable borrowers-per-staff figures suggest collection discipline held up better than the workforce contraction alone might have indicated. For a sector that spent last year absorbing pressure from borrowers’ over-indebtedness, a weakening Joint Liability Group model, and high staff attrition, a nearly two-percentage-point decline in PAR>30 is meaningful. This suggests some of that stress is being eased.


MLI Loan Portfolio at Risk (PAR)
Portfolio quality at various overdue buckets based on weighted average values
Size-wise Portfolio quality (based on all overdue, including overdue above 179 days) - Weighted average value
Chapter 4 Section II
Asset Quality in MLIs
After a workforce that contracted for the first time in over a decade, even as ABS held steady, suggesting the leaner staff base didn’t come at the cost of coverage, asset quality tells a different recovery story. Portfolio At Risk beyond 30 days (PAR>30, including 180 +dpd) eased to 5.75% as on 31 March 2026 (in respect of the MLIs whose data was received) as against 7.52% at the end of FY2025-26. The improvement aligns with the trends documented in Chapter 4.I: a more field-heavy employee structure and stable borrowers-per-staff figures suggest collection discipline held up better than the workforce contraction alone might have indicated. For a sector that spent last year absorbing pressure from borrowers’ over-indebtedness, a weakening Joint Liability Group model, and high staff attrition, a nearly two-percentage-point decline in PAR>30 is meaningful. This suggests some of that stress is being eased.
That recovery, however, has not been evenly shared. The sector’s smallest institutions, those with portfolios under ₹100 crore, carried the highest PAR>30 of any size bucket at 12.22%, almost three times that of the 4.29% recorded by the largest MLIs (portfolio above ₹5,000 crore). The distribution of institutions tells the same story: even as the weighted sector average improved, the share of MLIs with PAR >30 dpd above 10% rose from 24% last year to 29% this year. In other words, the largest, best-capitalised players, who dominate the weighted average, pulled the number down, while a growing tail of smaller institutions remained. This bifurcation has a macro-financial dimension too: as the RBI has eased policy rates and system liquidity has improved1, the benefit has flowed disproportionately to larger, better-rated NBFC-MFIs with market access, while smaller institutions, more dependent on costlier bank and NBFC on-lending, have seen relatively little relief in their cost of funds, compounding the stress already visible in their portfolios. The chapter that follows looks at both halves of that picture: what allowed the sector’s core to stabilise, and why the improvement hasn’t yet reached its most vulnerable edge.
Portfolio quality remains a key indicator of the microfinance sector’s financial health, credit discipline, and sustainability. The Portfolio at Risk (PAR) above 30 days provides an important measure of emerging repayment stress by capturing the proportion of the outstanding portfolio with instalments overdue by more than 30 days. Tracking this indicator over time helps assess changes in borrower repayment behaviour, the effectiveness of collection and recovery mechanisms, and the sector’s ability to manage credit risk. It also serves as an early gauge of household-level financial stress in the wider rural economy, since microfinance borrowers are disproportionately exposed to swings in agricultural incomes, informal-sector earnings and local economic shocks that broader national indicators can mask. The trend in PAR >30 days over 2020–2026 also captures the sector’s recovery from pandemic-related disruptions and the subsequent emergence of new portfolio-quality pressures, including the industry-wide push for tighter household-indebtedness caps and fewer lenders per borrower that followed the 2024–25 stress cycle.
Figure 4.2.1: MLI Loan Portfolio at Risk (PAR)
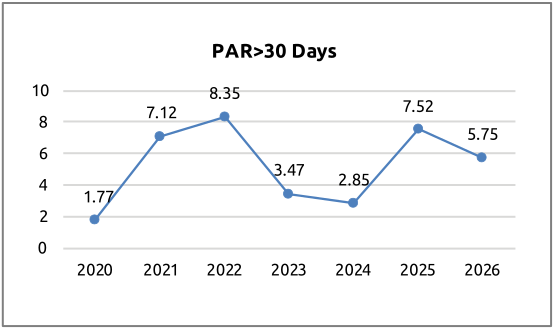
The PAR >30 days trend shows a marked deterioration during 2021–22, rising from 1.77% in 2020 to a peak of 8.35% in 2022, reflecting the lingering impact of pandemic-related disruptions on borrower repayment capacity and portfolio quality. Thereafter, portfolio quality improved substantially, with PAR >30 days declining to 3.47% in 2023 and 2.85% in 2024, indicating stronger collections and a recovery in borrower repayment behaviour, a period that coincided with strong national GDP growth of 8.2% in FY2023-24 and buoyant rural demand. A reversal occurred in 2025, when PAR >30 days rose to 7.52%, pointing to renewed portfolio stress that was driven more by sector-specific over-leveraging and JLG-model strain than by any broader economic slowdown; GDP growth remained strong at 6.5% through this period. In FY2025-26, the ratio moderated to 5.75%, an improvement of 177 basis points over 2025, although it remains well above the levels recorded in 2023–24. Overall, the trend suggests that while portfolio quality has improved from the recent deterioration, credit risk continues to be higher and requires closer attention to underwriting, borrower indebtedness, collection practices and early-warning monitoring.
The distribution of institutions by PAR levels provides a more granular view of portfolio quality and the concentration of credit risk across microfinance institutions. While aggregate PAR trends indicate the sector’s overall health, the distribution across risk bands helps identify the share of institutions experiencing low, moderate, or relatively high repayment stress. This is particularly relevant for assessing the sector’s resilience and the effectiveness of credit assessment, monitoring, and collection practices, and for anticipating which institutions have more credit exposure if rural income conditions were to soften.
1 Reserve Bank of India, Monetary Policy Committee statements, December 2025 and February 2026 (repo rate held at 5.25% in February 2026 following a 25-bps cut in December 2025). See “India Holds Rates, Revises Up FY25/26 GDP Forecasts,” Trading Economics, 6 February 2026. https://tradingeconomics.com/india/interest-rate/news/523674
Figure 4.2.2 Distribution of MLIs Based on PAR>30 dpd
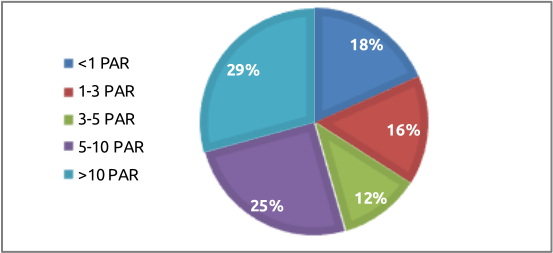
The distribution indicates a mixed portfolio-quality landscape. Around 18% of institutions have PAR> 30 dpd below 1%, suggesting very low levels of repayment stress. A further 16% fall in the 1–3% PAR range, while 12% report PAR between 3–5%. Together, 46% of institutions have PAR below 5%, indicating relatively healthy portfolio quality for nearly half of the institutions.
However, a significant proportion operates at higher levels of portfolio risk. 25% of institutions report PAR between 5–10%, while the largest single segment, 29%, has PAR above 10%. Thus, more than half of the institutions (54%) have PAR of 5% or higher, pointing to considerable variation in portfolio performance across the sector. But most of these institutions with higher PAR 30 are smaller and do not impact the overall average position.
The relatively high share of institutions with PAR above 10% warrants attention, particularly amid recent portfolio-quality pressures. Differences may stem from geographical concentration, borrower indebtedness, local economic conditions, collection challenges, and variations in underwriting and portfolio-management practices—factors that often trace back to state-level agricultural performance and rural wage trends rather than national aggregates, which can obscure meaningful regional divergence. Overall, while a sizeable segment maintains strong portfolio quality, the distribution highlights the need for continued early-warning systems, prudent credit assessment, borrower engagement and focused collection and recovery measures, alongside the sector’s self-regulatory efforts to cap household-level indebtedness and lender concentration.
Figure 4.2.3: Portfolio quality at various overdue buckets based on weighted average values
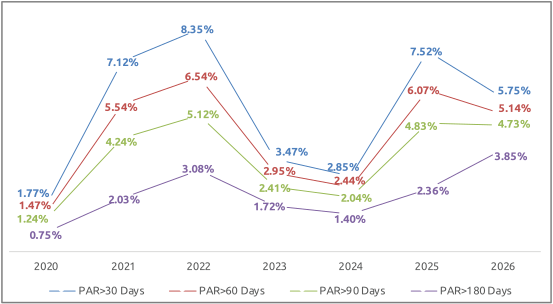
The trend in portfolio-at-risk across different delinquency buckets indicates that portfolio quality improved significantly during 2023–24 but came under renewed pressure in 2025, followed by a mixed recovery in 2026. PAR >30 days declined sharply from 8.35% in 2022 to 2.85% in 2024, with similar improvements across the >60, >90, and >180-day buckets. This improvement reflected stronger collections, a recovery in borrower cash flows, and tighter credit and portfolio-management practices, aided by a supportive economic backdrop through that period.
In FY2024-25, however, portfolio stress increased substantially, with PAR >30 days rising to 7.52%. In comparison, PAR >60 and PAR >90 days increased to 6.07% and 4.83%, respectively, a deterioration that occurred despite continued strength in the wider economy, underscoring its sector-specific origins. In FY2025-26, overall PAR >30 days improved to 5.75%, down 177 basis points from 2025. PAR >60 days also improved to 5.14%, while PAR >90 days marginally improved to 4.73%. These movements suggest some recovery in early-stage delinquency and collection performance.
However, the >180-day bucket tells a different story. PAR >180 days increased from 2.36% in 2025 to 3.85% in 2026, its highest level in the period shown. This indicates that while newer delinquencies appear to have moderated, a good portion of the stressed portfolio is ageing into deeper delinquency buckets — a pattern familiar from bank and NBFC non-performing-asset cycles more broadly, where early-stage stress typically resolves faster than legacy stress, which tends to linger even as headline ratios improve. The widening gap between PAR >30 and PAR >180 therefore warrants close monitoring, as it may indicate challenges in converting overdue accounts into successful recoveries, particularly for borrowers whose repayment capacity has not kept pace with the broader recovery in rural economic activity.
Overall, the FY2025-26 data suggest partial improvement in headline portfolio quality but continued underlying stress in the older delinquent portfolio. This highlights the importance of differentiated collection strategies, early intervention, borrower-level credit assessment and focused recovery of aged portfolios, especially for borrower segments whose incomes have not kept pace with the broader economic recovery.
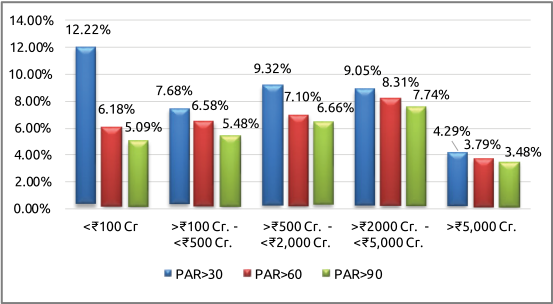
Figure 4.2.4: Size-wise Portfolio quality (based on all overdue, including overdue above 179 days)2 - Weighted average value
2 It needs to be noted that the overdue amount, which is above 180 days, excludes the technical write-off amount; therefore, it may look lower than the data mentioned in Chapter 2.
Portfolio quality by institution size shows clear variation in repayment stress across portfolio segments. Smaller institutions with portfolios below ₹100 crore record the highest PAR levels, with PAR >30, >60 and >90 days at 12.22%, 6.18% and 5.09%, respectively. Portfolio quality improves among institutions in the ₹100–500 crore category, although PAR >30 days remains elevated at 7.68%. The ₹500–2,000 crore segment records PAR >30 of 9.32%, while the ₹2,000–5,000 crore category shows similarly high stress at 9.05%, with PAR >60 and >90 days at 8.31% and 7.74%, respectively — a reminder that stress in this cycle has not been confined to the smallest players, but has cut across the mid-market as well.
In contrast, institutions with portfolios above ₹5,000 crore show substantially stronger portfolio quality, with PAR >30, >60, and >90 days at only 4.29%, 3.79%, and 3.48%, respectively. This suggests that larger institutions may benefit from greater diversification, stronger credit and risk-management systems, better access to technology and data, and greater institutional capacity for monitoring and collections. They are also better placed to benefit from the current monetary easing cycle: with the RBI having cut rates and system liquidity improving through late 2025 and early 2026, larger, higher-rated NBFC-MFIs have generally seen faster and fuller pass-through to their cost of funds than smaller entities, widening an already meaningful competitive gap. The relatively higher delinquency levels among smaller and mid-sized institutions may reflect these higher operating and funding costs, concentrated geographic exposure, limited risk-management capacity and greater vulnerability to localised economic or repayment shocks. Overall, the data underline the importance of strengthening credit assessment, early-warning mechanisms and recovery capabilities, particularly among smaller institutions, as well as the case for differentiated funding support so that scale alone does not become the main determinant of survival.
Conclusion
The analysis of portfolio quality highlights a mixed but gradually stabilising credit environment for the microfinance sector in FY2025-26, set against a national economy that continued to expand at a healthy pace — India’s real GDP grew by an estimated 7.4% in FY2025-26. After the significant improvement witnessed during 2023–24, portfolio stress increased sharply in FY2024-25, while FY2025-26 has seen a moderation in early-stage delinquency, with PAR >30 and PAR >60 days improving from the previous year. However, the continued increase in the PAR >180-day bucket indicates that a portion of stressed accounts is ageing and remains a concern for recoveries and portfolio health, even as the broader economy and a reasonable kharif harvest provided a supportive, if not especially generous, backdrop for borrower incomes.
Portfolio quality also varies considerably by institutional size. Larger institutions, particularly those with portfolios above ₹5,000 crore, report substantially lower delinquency levels, while smaller institutions show comparatively higher PAR across the major delinquency buckets. This suggests that scale, portfolio diversification, stronger risk-management systems, technology adoption and greater collection capacity can contribute to better portfolio resilience — advantages reinforced by easier access to the benefits of the RBI’s softer rate cycle. At the same time, smaller institutions may remain more vulnerable to geographic concentration, localised shocks, higher funding costs and resource constraints, underscoring why scale alone should not be allowed to become the deciding factor in which institutions survive this consolidation.
Overall, the 2026 trends suggest that the sector is moving towards greater credit discipline and more measured growth, but portfolio stress remains uneven, and the improvement so far owes as much to a benign macro environment, solid GDP growth, a reasonable harvest, and a softening interest-rate cycle, as it does to structural fixes within the sector itself. Sustained attention to household-level credit assessment, borrower indebtedness, early-warning systems, responsible collections and resolution of aged overdue accounts will be important to ensure that the recent improvement translates into durable portfolio quality and sustainable growth, particularly if farm-gate incomes remain soft or the favourable funding environment does not extend evenly to smaller and mid-sized institutions.