


Chapter 2 Section 2.3Loan Outstanding Analysis
The sector’s loan outstanding contracted from ₹3,74,006 Cr. in March 2025 to ₹3,33,907 Cr. in March 2026, a decline of 11%.


Loan Outstanding (in ₹ Cr.) across micro-lenders
Market Share of micro-lenders in terms of Loan Outstanding (in %)
Regional distribution of loan outstanding (in %)
2.3 Loan Outstanding Analysis
2.3.1 Loan Outstanding (in ₹ Cr.)
Figure 2.3: Loan Outstanding (in ₹ Cr.) across micro-lenders
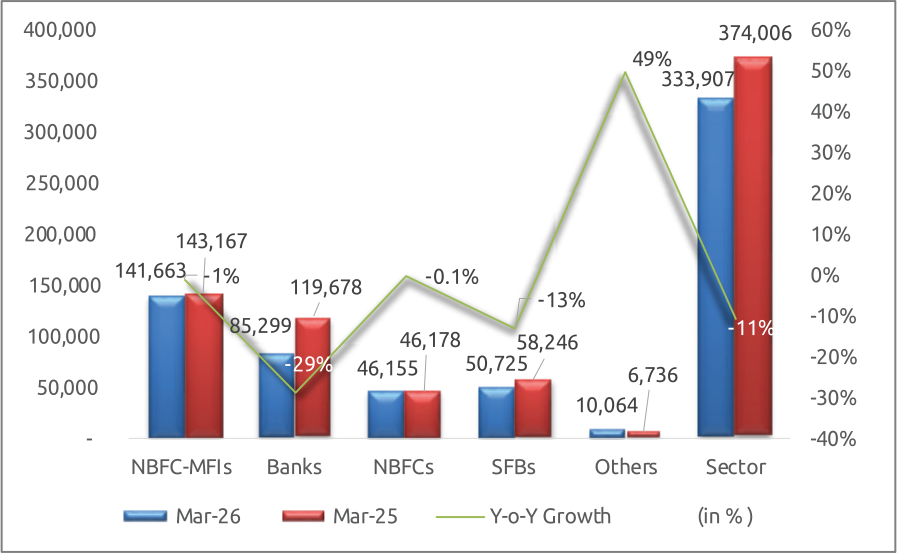
The sector’s loan outstanding contracted from ₹3,74,006 Cr. in March 2025 to ₹3,33,907 Cr. in March 2026, reflecting a decline of 11%. Every lender category except Other lenders recorded a year-on-year decline in loan outstanding, though the magnitude of decline varied sharply: Banks contracted by (-29%), the steepest among all categories, followed by SFBs at (-13%), while NBFC-MFIs and NBFCs contracted by only (-1%) and (-0.1%), respectively. One of the probable reasons for the decline in loan outstanding is the imposition of stricter guardrails by the SRO’s in response to overleveraging, which caused the micro-lenders to tighten eligibility and reduce disbursements, thereby shrinking the overall loan outstanding. The second reason is due to the lack of adequate funding support, which was addressed to some extent towards the end of the year, and may not have been reflected in the performance of FY 2025-26. The Government of India (GOI) introduced a guarantee scheme called Credit Guarantee Scheme for MFI 2.0 (CGSMFI 2.0), similar to the one introduced during COVID-19, with a higher corpus of ₹20,000 crore and a separate quota for small, medium and other MFIs.
Box 2.1: CGSMFI-2.0: Strengthening Credit Flow to Microfinance Institutions
Access to institutional funding remains critical for Microfinance Institutions (MFIs), particularly small and medium-sized institutions. During periods of funding constraints, Sa-Dhan, as an industry association and RBI-recognised SRO, consistently engaged with policymakers, banks, financial institutions and other stakeholders to highlight challenges in accessing bank finance, articulate the sector’s funding needs, and promote a conducive funding and regulatory environment to strengthen lender confidence and improve credit flow. Sa-Dhan also strongly recommended a dedicated allocation within the guarantee mechanism for small and medium-sized MFIs, ensuring that institutions facing greater challenges in accessing institutional and collateral-based credit can adequately benefit from the guarantee.
These efforts helped build a stronger case for a risk-sharing mechanism for lending to MFIs. The Government of India subsequently introduced CGSMFI-2.0 on 20 March 2026, with the objective of providing guarantee cover to eligible lending institutions for finance extended to NBFC-MFIs and MFIs for on-lending to small borrowers. The scheme envisaged facilitating credit flow of up to ₹20,000 crore to the sector.
Under the scheme, the guarantee coverage varies according to the size of the NBFC-MFI/MFI. Small institutions with AUM below ₹500 crore receive 80% guarantee cover, medium institutions with AUM of ₹500 crore to below ₹2,000 crore receive 75%, and large institutions with AUM of ₹2,000 crore and above receive 70%. The financial assistance is subject to an overall ceiling of 20% of the institution’s AUM. Following the June 2026 revision, the maximum loan amount for large NBFC-MFIs/MFIs was increased from ₹300 crore to ₹1,000 crore.
The scheme also provides for an interest-rate cap. Loans from MLIs to NBFC-MFIs/MFIs are capped at one-year MCLR or EBLR plus 2% per annum. For onward lending to small borrowers, the interest rate is capped at 1% below the institution’s average lending rate during the preceding six months. The guarantee fee is 0.50% per annum, calculated on the sanctioned amount during the first year and on the outstanding amount thereafter.
An important feature of CGSMFI-2.0 is its focus on improving access to funding for smaller and mid-sized MFIs. The scheme requires MLIs to allocate at least 5% of the total sanctioned amount to small NBFC-MFIs/MFIs with AUM below ₹500 crore and at least 10% to medium-sized institutions with AUM between ₹500 crore and ₹2,000 crore. This provision is intended to broaden the reach of the guarantee facility beyond the larger institutions.
As of 10 June 2026, loans aggregating ₹770 crore had been sanctioned under the scheme. The Government subsequently extended the validity of CGSMFI-2.0 up to 31 August 2026, or until guarantees amounting to ₹20,000 crore were issued, whichever was earlier.
CGSMFI-2.0 thus provides a risk-sharing mechanism between lenders and the guarantee framework, with the potential to improve liquidity and diversify funding sources for MFIs, particularly smaller and mid-sized institutions. Its effectiveness will depend on the extent to which eligible institutions are able to access the facility and translate the additional funding into responsible and sustainable lending to small borrowers.
2.3.2 State/UT-wise Loan Outstanding (in ₹ Cr.)
Table 2.4 outlines the loan outstanding across States and Union Territories. Year-on-Year analysis reveals that 30 States/UTs experienced a decline in loan outstanding, while only 6 States with relatively smaller microfinance exposure—Arunachal Pradesh (33%), Meghalaya (18%), Mizoram (14%), Nagaland (13%), Punjab (7%), and Assam (5%) registered positive Y-o-Y growth.
Table 2.4 Loan Outstanding (in ₹ Cr.) of all micro-lenders across States/UTs - March 2026 and March 2025 (in descending order of Loan Outstanding)
| Sl. No. | State/UT | March 2026 (in ₹ Cr.) |
March 2025 (in ₹ Cr.) |
Y-o-Y Growth (in %) |
|---|---|---|---|---|
| 1 | Bihar | 53,010 | 57,206 | -7% |
| 2 | Tamil Nadu | 41,004 | 45,866 | -11% |
| 3 | Uttar Pradesh | 39,680 | 41,305 | -4% |
| 4 | Karnataka | 29,429 | 34,928 | -16% |
| 5 | West Bengal | 28,054 | 35,950 | -22% |
| 6 | Maharashtra | 24,845 | 28,390 | -12% |
| 7 | Madhya Pradesh | 19,824 | 21,444 | -8% |
| 8 | Odisha | 17,387 | 20,139 | -14% |
| 9 | Rajasthan | 13,799 | 15,611 | -12% |
| 10 | Jharkhand | 10,911 | 11,176 | -2% |
| 11 | Gujarat | 9,120 | 10,661 | -14% |
| 12 | Keralam | 8,824 | 11,234 | -21% |
| 13 | Assam | 6,874 | 6,517 | 5% |
| 14 | Chhattisgarh | 5,750 | 6,429 | -11% |
| 15 | Andhra Pradesh | 5,577 | 5,660 | -1% |
| 16 | Punjab | 5,183 | 4,846 | 7% |
| 17 | Haryana | 4,926 | 5,285 | -7% |
| 18 | Telangana | 4,325 | 4,785 | -10% |
| 19 | Tripura | 1,465 | 2,093 | -30% |
| 20 | Uttarakhand | 1,378 | 1,692 | -19% |
| 21 | Puducherry | 941 | 973 | -3% |
| 22 | Delhi | 498 | 590 | -16% |
| 23 | Himachal Pradesh | 179 | 184 | -2% |
| 24 | Meghalaya | 165 | 140 | 18% |
| 25 | Arunachal Pradesh | 134 | 101 | 33% |
| 26 | Mizoram | 123 | 108 | 14% |
| 27 | Goa | 99 | 149 | -33% |
| 28 | Others | 93 | 142 | -35% |
| 29 | Jammu & Kashmir | 78 | 93 | -16% |
| 30 | Sikkim | 70 | 119 | -41% |
| 31 | Nagaland | 67 | 59 | 13% |
| 32 | Manipur | 41 | 75 | -45% |
| 33 | Chandigarh | 32 | 34 | -5% |
| 34 | Andaman & Nicobar Islands | 17 | 17 | -3% |
| 35 | Dadra and Nagar Haveli and Daman and Diu | 5 | 6 | -15% |
| 36 | Lakshadweep | 0.004 | 0.010 | -59% |
| 37 | Ladakh | 0.000 | 0.003 | -100% |
| Sector | 3,33,907 | 3,74,006 | -11% |
Bihar retained its position as the largest microfinance market in the country, accounting for 16% of the sector’s loan outstanding, followed by Tamil Nadu and Uttar Pradesh at 12% each. Together, the top 5 states, Bihar, Tamil Nadu, Uttar Pradesh, Karnataka and West Bengal, account for 57% of the sector’s loan outstanding, indicating that microfinance credit exposure remains geographically concentrated within a few key states.
Notably, the principal key states with the highest loan outstanding, including West Bengal (-22%), Karnataka (-16%), Tamil Nadu (-11%), Bihar (-7%), and Uttar Pradesh (-4%), etc., saw a contraction in the loan outstanding, reflecting broad-based negative growth in these key states.
Figure 2.4: Market Share (in %) of micro-lenders in terms of Loan Outstanding (in ₹ Cr.)
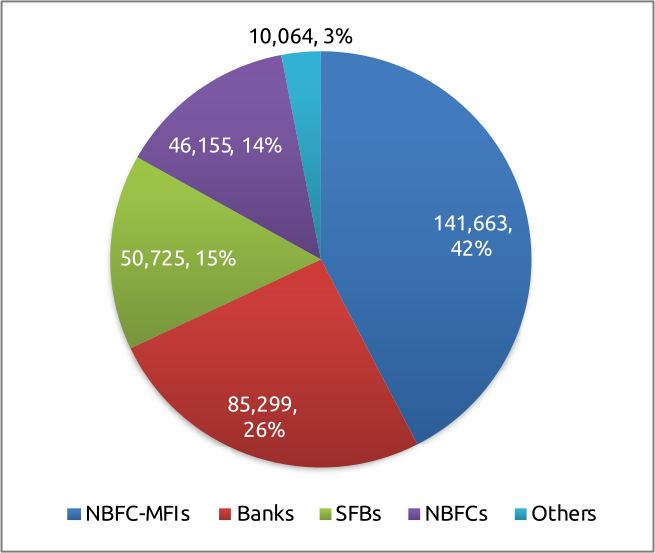
In terms of market share of loan outstanding, NBFC-MFIs remain the dominant provider of microcredit, accounting for 42% of the total market. Banks held the second-largest share with 26%, followed by Small Finance Banks (SFBs) at 15%, NBFCs at 14%, and Others comprising the remaining 3%.
2.3.3 State/UT-wise Loan Outstanding per Unique Active Borrower (in ₹)
Table 2.5 provides data on loan outstanding per unique active borrower across States and Union Territories, showing modest year-on-year growth of 3%. This marginal increase is mainly attributable to a more cautious and risk-limiting stance adopted by micro-lenders in response to rising delinquencies and increased borrower leverage. Additional contributing factors include limiting measures imposed by the SROs, such as restrictions on the number of micro-lenders and caps on combined microfinance and retail loan exposure for households, which is not to exceed ₹2 lakhs.
Table 2.5 Loan Outstanding per Unique Active Borrower across States/UTs (in ₹) - March 2026 and March 2025 (in descending order of Loan Outstanding per Unique Active Borrower)
| Sl. No. | State/UT | March 2026 (in ₹) |
March 2025 (in ₹) |
Y-o-Y Growth (in %) |
|---|---|---|---|---|
| 1 | Bihar | 59,070 | 50,049 | 18% |
| 2 | Arunachal Pradesh | 58,161 | 42,010 | 38% |
| 3 | Karnataka | 55,483 | 54,686 | 1% |
| 4 | Jharkhand | 53,969 | 46,609 | 16% |
| 5 | Puducherry | 52,983 | 52,722 | 0.5% |
| 6 | Tamil Nadu | 51,537 | 59,191 | -13% |
| 7 | Himachal Pradesh | 50,680 | 44,882 | 13% |
| 8 | Keralam | 50,591 | 52,543 | -4% |
| 9 | Uttar Pradesh | 50,225 | 44,408 | 13% |
| 10 | Maharashtra | 49,119 | 46,260 | 6% |
| 11 | Odisha | 49,117 | 48,300 | 2% |
| 12 | Haryana | 48,792 | 46,063 | 6% |
| 13 | Punjab | 48,329 | 44,303 | 9% |
| 14 | West Bengal | 47,752 | 48,479 | -1% |
| 15 | Rajasthan | 47,273 | 46,661 | 1% |
| 16 | Andaman & Nicobar Islands | 46,517 | 41,096 | 13% |
| 17 | Madhya Pradesh | 46,338 | 45,067 | 3% |
| 18 | Chhattisgarh | 46,005 | 45,639 | 1% |
| 19 | Uttarakhand | 45,025 | 44,380 | 1% |
| 20 | Goa | 44,591 | 42,777 | 4% |
| 21 | Dadra and Nagar Haveli and Daman and Diu | 44,042 | 36,710 | 20% |
| 22 | Tripura | 43,617 | 49,396 | -12% |
| 23 | Jammu & Kashmir | 43,276 | 45,440 | -5% |
| 24 | Gujarat | 42,844 | 42,192 | 2% |
| 25 | Mizoram | 40,527 | 28,509 | 42% |
| 26 | Delhi | 39,984 | 39,747 | 1% |
| 27 | Nagaland | 39,358 | 37,466 | 5% |
| 28 | Meghalaya | 38,967 | 32,112 | 21% |
| 29 | Assam | 38,682 | 39,834 | -3% |
| 30 | Chandigarh | 38,427 | 37,020 | 4% |
| 31 | Sikkim | 33,939 | 39,311 | -14% |
| 32 | Telangana | 33,900 | 37,690 | -10% |
| 33 | Andhra Pradesh | 30,492 | 30,588 | -0.3% |
| 34 | Lakshadweep | 19,967 | 19,344 | 3% |
| 35 | Manipur | 18,877 | 24,936 | -24% |
| 36 | Others | 6,611 | 28,766 | -77% |
| 37 | Ladakh | N.A. | 6,332 | N.A. |
| Sector | 49,658 | 48,171 | 3% |
On a Y-o-Y comparison, 10 States/UTs recorded a decline in loan outstanding per borrower, while 25 States/UTs registered positive growth in loan outstanding per borrower. The principal key states with substantial loan outstanding, such as Bihar (18%), Uttar Pradesh (13%), Maharashtra (6%), Madhya Pradesh (3%), Odisha (2%), Karnataka (1%), Rajasthan (1%), etc., registered growth in loan outstanding per borrower, while Tamil Nadu (-13%) and West Bengal (-1%) registered a decline in loan outstanding per borrower.
Figure 2.5: Percentage of Rural, Urban and Semi-Urban Share of Micro-Lenders Loan Outstanding
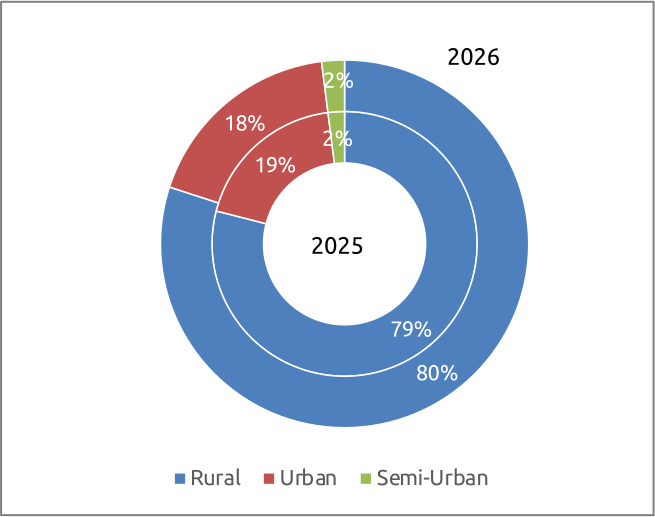
As illustrated in Figure 2.5, the loan outstanding geographical composition continues to exhibit a pronounced rural orientation. During FY 2025-26, the rural segment accounted for 80% of the aggregate loan outstanding, with the urban and semi-urban segments contributing 18% and 2%, respectively. This distribution is broadly consistent with the pattern observed in FY 2024-25, when the rural segment constituted 79% of the aggregate loan outstanding, while the urban and semi-urban segments accounted for 19% and 2%, respectively — reflecting a marginal but noteworthy 1 percentage-point shift toward rural concentration year-on-year. This sustained and deepening skew toward rural geographies across both financial years reaffirms that microfinance, in its essential nature, remains fundamentally a rural phenomenon, being oriented toward addressing the credit needs of underserved and financially excluded rural populations who typically fall outside the ambit of conventional banking channels.
Figure 2.6: Regional distribution of Loan Outstanding (in %)
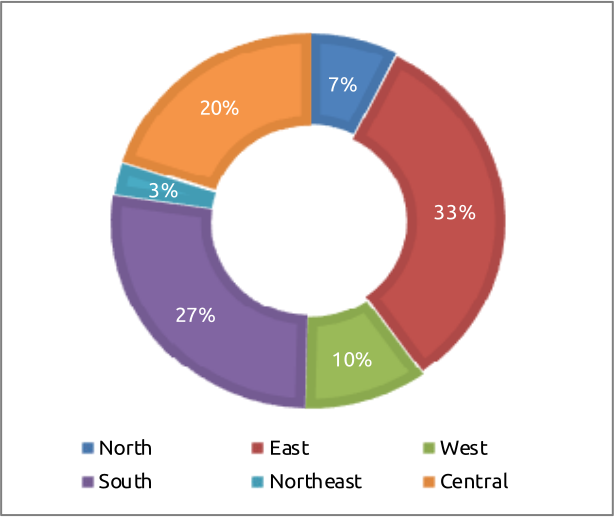
In terms of regional distribution of loan outstanding, the Eastern region—comprising Bihar, Odisha, Jharkhand, West Bengal, and Andaman & Nicobar Islands—led with a 33% market share. This was followed by the Southern region, which includes Andhra Pradesh, Karnataka, Keralam, Tamil Nadu, Telangana, Puducherry, and Lakshadweep, accounting for 27%. The Central region, consisting of Madhya Pradesh, Uttar Pradesh, Chhattisgarh, and Uttarakhand, held 20% of the market share. The Western region, covering Gujarat, Maharashtra, Goa, and Dadra and Nagar Haveli and Daman and Diu, contributed 10%, while the Northern region—encompassing Delhi, Haryana, Rajasthan, Punjab, Chandigarh, Himachal Pradesh, Jammu & Kashmir, and Ladakh—accounted for 7%. The Northeastern states, including Assam, Manipur, Tripura, Nagaland, Sikkim, Meghalaya, Mizoram, and Arunachal Pradesh, have the smallest share at 3%.
2.3.4 State/UT-wise Average Balance per Loan Account (in ₹)
The State and Union Territory-wise average balance per loan account is detailed in Table 2.6. As of March 31, 2026, the overall average balance per loan account in the microfinance sector stood at ₹32,116, reflecting a year-on-year growth of 13% from ₹28,385 as on March 31, 2025.
Table 2.6: Average Balance per Loan Account (in ₹) - March 2026 and March 2025 (in descending order of Average Balance per Loan Account)
| Sl. No. | State/UT | March 2026 (in ₹) |
March 2025 (in ₹) |
Y-o-Y Growth (in %) |
|---|---|---|---|---|
| 1 | Andaman & Nicobar Islands | 43,249 | 37,626 | 15% |
| 2 | Arunachal Pradesh | 38,104 | 30,590 | 25% |
| 3 | Puducherry | 37,908 | 31,184 | 22% |
| 4 | Tamil Nadu | 36,243 | 31,410 | 15% |
| 5 | Himachal Pradesh | 35,567 | 31,895 | 12% |
| 6 | Bihar | 34,317 | 28,950 | 19% |
| 7 | Delhi | 33,883 | 31,109 | 9% |
| 8 | Dadra and Nagar Haveli and Daman and Diu | 33,792 | 28,735 | 18% |
| 9 | Mizoram | 33,628 | 26,417 | 27% |
| 10 | Haryana | 33,457 | 29,066 | 15% |
| 11 | Karnataka | 33,272 | 28,396 | 17% |
| 12 | Uttar Pradesh | 32,886 | 28,438 | 16% |
| 13 | Rajasthan | 32,196 | 28,451 | 13% |
| 14 | Meghalaya | 31,744 | 27,055 | 17% |
| 15 | Gujarat | 31,718 | 27,760 | 14% |
| 16 | Tripura | 31,386 | 32,036 | -2% |
| 17 | West Bengal | 31,293 | 30,411 | 3% |
| 18 | Nagaland | 31,258 | 32,628 | -4% |
| 19 | Madhya Pradesh | 31,172 | 27,653 | 13% |
| 20 | Uttarakhand | 31,110 | 27,988 | 11% |
| 21 | Assam | 31,085 | 26,933 | 15% |
| 22 | Jharkhand | 31,009 | 26,862 | 15% |
| 23 | Chhattisgarh | 30,673 | 27,193 | 13% |
| 24 | Punjab | 30,580 | 25,743 | 19% |
| 25 | Maharashtra | 30,124 | 27,010 | 12% |
| 26 | Keralam | 29,977 | 27,886 | 7% |
| 27 | Sikkim | 29,549 | 33,185 | -11% |
| 28 | Jammu & Kashmir | 28,954 | 30,062 | -4% |
| 29 | Goa | 28,750 | 26,108 | 10% |
| 30 | Odisha | 28,203 | 24,957 | 13% |
| 31 | Chandigarh | 26,634 | 25,368 | 5% |
| 32 | Telangana | 25,740 | 27,408 | -6% |
| 33 | Andhra Pradesh | 24,993 | 22,903 | 9% |
| 34 | Manipur | 18,267 | 22,701 | -20% |
| 35 | Lakshadweep | 9,983 | 16,120 | -38% |
| 36 | Others | 6,358 | 22,578 | -72% |
| 37 | Ladakh | N.A. | 6,332 | N.A. |
| Sector | 32,116 | 28,385 | 13% |
On a Y-o-Y comparison, 7 States and UTs, viz. Lakshadweep (-38%), Manipur (-20%), Sikkim (-11%), Telangana (-6%), Nagaland and Jammu & Kashmir (-4% each) and Tripura (-2%) experienced a decrease in average balance per loan account. The principal key states with substantial loan outstanding, such as Bihar (19%), Karnataka (17%), Uttar Pradesh (16%), Tamil Nadu and Jharkhand (15% each), Madhya Pradesh, Rajasthan, and Odisha (13% each), and Maharashtra (12%), etc., registered positive Y-o-Y growth in average balance per loan account.
2.3.5 Top States and Districts in terms of Loan Outstanding
The top 10 States and top 25 districts in terms of total loan outstanding at the end of FY 2025-26 are given in Table 2.7 and Table 2.8, respectively. Bihar continues to be the top state in terms of loan outstanding, accounting for 16% of the sector’s loan outstanding, and the top 5 states account for nearly 57% of the sector’s loan outstanding.
Table 2.7: Top 10 States in terms of Loan Outstanding (in ₹ Cr.)
| Microfinance Sector – all micro-lenders | ||
|---|---|---|
| Sl. No. | State | Loan Outstanding (in ₹ Cr.) |
| 1 | Bihar | 53,010 |
| 2 | Tamil Nadu | 41,004 |
| 3 | Uttar Pradesh | 39,680 |
| 4 | Karnataka | 29,429 |
| 5 | West Bengal | 28,054 |
| 6 | Maharashtra | 24,845 |
| 7 | Madhya Pradesh | 19,824 |
| 8 | Odisha | 17,387 |
| 9 | Rajasthan | 13,799 |
| 10 | Jharkhand | 10,911 |
The top 10 states accounted for 83% of the share in the sector loan outstanding, while the top 5 states alone accounted for 57% of the sector loan outstanding.
Similarly, the loan outstanding of the top 25 districts in the country is mapped and given below. This data is the cumulative outstanding of all the micro-lenders as of 31st March 2026 in these 25 districts.
Table 2.8 Top 25 Districts in terms of Loan Outstanding (in ₹ Cr.)
| Microfinance Sector – all micro-lenders | |||
|---|---|---|---|
| Sl. No. | State | District | Loan Outstanding (in ₹ Cr.) |
| 1 | Bihar | Purbi Champaran | 4,004 |
| 2 | Bihar | Muzaffarpur | 3,624 |
| 3 | West Bengal | Murshidabad | 3,368 |
| 4 | Bihar | Samastipur | 3,199 |
| 5 | Bihar | Darbhanga | 2,946 |
| 6 | Bihar | Paschim Champaran | 2,770 |
| 7 | Bihar | Madhubani | 2,656 |
| 8 | Tamil Nadu | Cuddalore | 2,570 |
| 9 | Karnataka | Belagavi | 2,395 |
| 10 | West Bengal | North 24 Parganas | 2,386 |
| 11 | Uttar Pradesh | Gorakhpur | 2,245 |
| 12 | Tamil Nadu | Thanjavur | 2,214 |
| 13 | Bihar | Araria | 2,174 |
| 14 | Karnataka | Mysuru | 2,083 |
| 15 | Bihar | Begusarai | 2,004 |
| 16 | West Bengal | South 24 Parganas | 1,937 |
| 17 | Tamil Nadu | Madurai | 1,906 |
| 18 | Karnataka | Bengaluru Urban | 1,897 |
| 19 | Tamil Nadu | Salem | 1,856 |
| 20 | Bihar | Vaishali | 1,823 |
| 21 | Bihar | Gaya | 1,786 |
| 22 | Karnataka | Tumakuru | 1,745 |
| 23 | Bihar | Sitamarhi | 1,734 |
| 24 | Bihar | Katihar | 1,716 |
| 25 | West Bengal | Hooghly | 1,715 |
The top 25 districts by loan outstanding included 12 districts from Bihar, 4 districts each from Karnataka, Tamil Nadu, and West Bengal, and 1 district from Uttar Pradesh. The top 15 districts had loan outstanding exceeding ₹2,000 Cr., while Purbi Champaran district of Bihar recorded the highest loan outstanding, exceeding ₹4,000 Cr. The combined loan outstanding of the top 25 districts accounted for 18% of the sector loan outstanding, while the top 10 districts alone contributed 9%. A notable decline was observed in the number of districts with loan outstanding greater than ₹2,000 Cr., falling from 24 as of 31 March, 2025, to 15 as of 31 March, 2026.
2.3.6 District-wise Loan Outstanding
Figure 2.7: Geographic Distribution of Microfinance Loan Outstanding across Districts (as of March 2026)
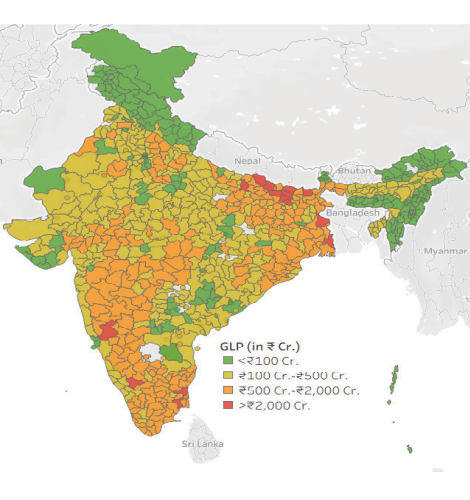
Table 2.9 District Distribution by Loan Outstanding Category
| Loan Outstanding Category | No. of Districts |
|---|---|
| <₹100 Cr. | 216 |
| ₹100 Cr. - ₹500 Cr. | 334 |
| ₹500 Cr. - ₹2,000 Cr. | 215 |
| >₹2,000 Cr. | 15 |
According to data from Equifax India, micro-lenders operate across nearly 780 districts in 28 States and 7 Union Territories. Among these, 15 districts have loan outstanding exceeding ₹2,000 Cr. This group includes 8 districts in Bihar, 2 districts each in Karnataka, Tamil Nadu and West Bengal, and 1 district in Uttar Pradesh. A further breakdown reveals that 11 districts have loan outstanding above ₹2,000 Cr. but less than ₹3,000 Cr., 3 districts have loan outstanding exceeding ₹3,000 Cr. but less than ₹4,000 Cr., and only 1 district (Purbi Champaran of Bihar) recorded loan outstanding above ₹4,000 Cr.
The number of districts with GLP above ₹2,000 Cr. declined from 24 in FY 2024-25 to 15 in FY 2025-26. Loan outstanding between ₹500 Cr. and ₹2,000 Cr. was reported in 215 districts, primarily from states such as Bihar, Tamil Nadu, Uttar Pradesh, West Bengal, Karnataka, Madhya Pradesh, Odisha, Jharkhand, Rajasthan, and Maharashtra. Additionally, 334 districts recorded loan outstanding in the range of ₹100 Cr.–₹500 Cr., while another 216 districts have loan outstanding below ₹100 Cr.
2.3.7 Aspirational Districts – Loan Outstanding
Aspirational Districts4 are the 112 districts identified by NITI Aayog in January 2018 to boost human development outcomes across health and nutrition, education, agriculture and water resources, financial inclusion, skill development, and basic infrastructure, and they remain a closely watched segment within India’s microfinance sector as of March 2026.
Table 2.10 Loan Outstanding Amount (in ₹ Cr.) in Aspirational Districts by Micro Lender Type (March 2026 and March 2025)
| Micro Lender | March 2026 | March 2025 | Micro Lender Share (in %) | Y-o-Y Growth (in %) |
|---|---|---|---|---|
| NBFC-MFIs | 23,192 | 22,605 | 46% | 3% |
| Banks | 13,446 | 18,164 | 26% | -26% |
| NBFCs | 6,496 | 6,111 | 13% | 6% |
| SFBs | 6,370 | 7,183 | 13% | -11% |
| Others | 1,235 | 661 | 2% | 87% |
| Overall | 50,739 | 54,724 | -7% |
As of March 2026, the loan outstanding across aspirational districts stood at ₹50,739 crore, accounting for 15% of the total microfinance sector portfolio. On a year-on-year basis, the portfolio contracted by 7% from ₹54,724 crore in March 2025, demonstrating greater resilience than the broader sector, which registered a decline of 11% over the same period. Also, channelling ₹50,739 Cr. (15% of the sector loan outstanding) into 112 Aspirational Districts directly supports targeted poverty alleviation and bridges regional credit disparities.
Figure 2.8: Share of Microfinance Loan Outstanding across Aspirational Districts by Micro-Lender Type (as of March 2026)
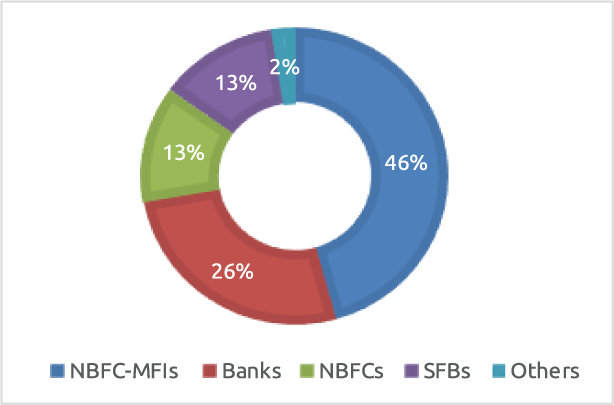
Among the micro-lenders, NBFC-MFIs have the maximum share of loan outstanding of 46% in the aspirational districts, followed by Banks at 26%, SFBs and NBFCs at 13% each and Others (2%), respectively.
4 https://www.niti.gov.in/sites/default/files/2022-09/List-of-Aspirational-Districts.pdf