


Chapter 4 - Section 4.5Balance Sheet and Capital Structure
The Indian Accounting Standards (Ind AS) for asset classification and income recognition, anchored by a forward-looking Expected Credit Loss (ECL) model, rather than simple days-past-due metrics, has become an established part of how MLIs report and how auditors assess loan-loss provisioning, statistical assumptions, and management judgment. For auditors, this continues to widen the scope of review well beyond quantitative accuracy in financial statements, into the qualitative soundness of governance, board-approved policies on household income assessment, transparent pricing, and borrower protection, which remain central areas of scrutiny, in line with the RBI’s broader vision of responsible lending and sustainable financial inclusion.


Chapter 4 Section V
Balance Sheet and Capital Structure
The Indian Accounting Standards (Ind AS) for asset classification and income recognition, anchored by a forward-looking Expected Credit Loss (ECL) model, rather than simple days-past-due metrics, has become an established part of how MLIs report and how auditors assess loan-loss provisioning, statistical assumptions, and management judgment. For auditors, this continues to widen the scope of review well beyond quantitative accuracy in financial statements, into the qualitative soundness of governance, board-approved policies on household income assessment, transparent pricing, and borrower protection, which remain central areas of scrutiny, in line with the RBI’s broader vision of responsible lending and sustainable financial inclusion.
After the contraction of the business portfolio witnessed in FY2024-25, when total assets fell by nearly 35% due to portfolio shrinkage, the sector staged a recovery in FY2025-26. MLI total assets rose by about 38% to ₹2,00,654 crore, with the loan portfolio continuing to account for the bulk of the asset base. Funding flows recovered as fresh equity raised grew by nearly 38% over the previous year, while outstanding borrowings rose by over 50%, reflecting a return of lender and investor confidence after a cautious FY2024-25. Importantly, this growth was accompanied by a stronger capital position: the median Capital Adequacy Ratio improved from about 33% to over 40%. At the same time, the debt-equity ratio eased from 2.3 to 1.76, pointing to more conservative leverage even as balance sheets expanded. The sections that follow examine these trends, assets, net owned funds, equity, debt funding, and capital adequacy, in greater detail.
4.5.1 Assets of MLIs
The amount of loans outstanding is the key asset for the microfinance institutions and is an indicator of the strength of the balance sheet. It reflects the cumulative value of loans held by borrowers at a given point in time and indicates changes in lending activity, portfolio growth, and the sector’s overall outreach. Examining the trend in loan amount outstanding over time helps to assess the sector’s long-term growth trajectory, periods of expansion or contraction, and its recovery following periods of stress or market adjustment. The following analysis presents the movement in total assets and highlights the significant changes observed in 2026.
Figure 4.5.1: MLI Total Assets- Yearly Trend
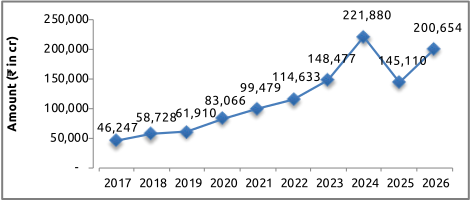
The trend shows a strong long-term expansion in the amount outstanding, rising from ₹46,247 crore in 2017 to ₹2,00,654 crore in 2026, representing more than a four-fold increase over the period. Growth was gradual during 2017–19, then accelerated steadily from ₹83,066 crore in 2020 to ₹1,48,477 crore in 2023. The amount peaked at ₹2,21,880 crore in 2024 before declining sharply to ₹1,45,110 crore in 2025. This contraction was followed by a strong comeback in 2026, with the amount rising about 38% year on year to ₹2,00,654 crore.
The recovery of 2026 indicates a substantial rebuilding of financial activity after the sharp correction in 2025. However, the amount outstanding still remains around 9.6% below the 2024 peak, suggesting that the sector has not yet fully returned to its earlier level. The sharp movements in the last two years may reflect changes in portfolio growth, funding availability, lending activity, institutional risk appetite and broader sectoral consolidation. Overall, the longer-term trajectory remains one of significant expansion, while the recent fluctuations indicate a period of adjustment followed by renewed growth in 2026.
Distribution of Assets
The asset composition of microfinance institutions shows how institutions deploy resources and how well assets remain aligned with the core lending business. Examining the distribution of assets across loan outstanding, liquidity, investments, fixed assets and other assets helps assess the sector’s business orientation, liquidity position and balance-sheet structure.
Figure 4.5.2: Composition of Total Assets of MLIs
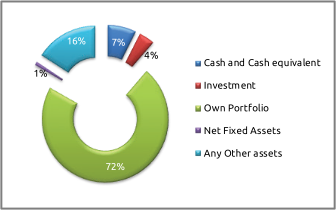
The asset composition of microfinance institutions is rightly concentrated in net loan outstanding, which accounts for 72% of total assets. This reflects the sector’s lending focus and indicates that most institutional resources remain deployed in the core credit portfolio. Other assets account for 16%, followed by cash and cash equivalents at 7% and investments at 4%, while net fixed assets constitute only 1%. Other assets include receivables and other financial assets, deferred tax, and intangible assets.
The high share of loans outstanding, close to three-fourths, is in the right direction, indicating the sector’s continued focus on credit delivery and financial inclusion. The 7% share for cash and cash equivalents indicates the liquidity buffer to meet operational and repayment-related requirements. The relatively modest share of investments suggests that institutions primarily deploy available resources towards their lending business rather than financial investments. Similarly, the low share of fixed assets is consistent with the relatively asset-light operating model of microfinance institutions. Overall, the asset structure indicates a predominantly credit-oriented and relatively liquid balance sheet, with limited capital tied up in physical infrastructure.
4.5.2 Funds for MLI operations
4.5.2.i Net Owned Fund
Net Owned Funds (NOF) represent the core capital base of a microfinance institution and measure its financial strength and capacity to absorb potential losses. Adequate NOF supports portfolio growth, meets regulatory requirements, and maintains the confidence of lenders, investors and other stakeholders. Tracking the level and composition of net owned funds therefore provides insight into the capital adequacy, resilience and growth capacity of institutions within the sector. Net Owned Funds for the MLIs as a whole for the financial year 2025-26 is at ₹33,184 crores. This is almost unchanged from the previous year.
4.5.2.ii Equity Outstanding
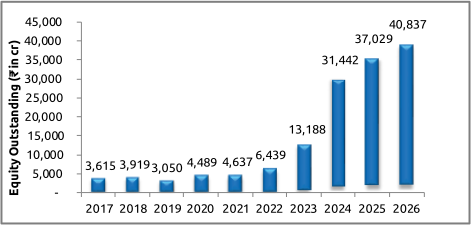
The microfinance sector’s equity base has expanded substantially over the past decade, indicating a significant strengthening of its capital base. Equity outstanding increased from ₹3,615 crore in 2017 to ₹40,837 crore in 2026, representing more than an eleven-fold increase. After fluctuations during 2017–21, equity growth accelerated significantly from ₹6,439 crore in 2022 to ₹13,188 crore in 2023, then rose further to ₹31,442 crore in 2024. The momentum continued in 2025 and 2026, with equity reaching ₹37,029 crore and ₹40,837 crore, respectively.
The sharp increase since 2023 suggests greater capital mobilisation and stronger institutional balance sheets, potentially supporting portfolio expansion, regulatory compliance, and the provision to absorb credit and operational losses. The more moderate growth in 2026, compared with the exceptionally large increases in 2023–25, may indicate a shift towards consolidation after significant capital strengthening. A stronger equity base also provides institutions with greater resilience amid portfolio-quality pressures and rising operating costs, while creating additional capacity to leverage external funding for sustainable growth. Overall, the sustained increase in equity indicates improved capital depth and financial resilience across the sector.
The distribution of equity outstanding shows a strong concentration among larger institutions and NBFC-MFIs, reflecting their scale and capital requirements. By portfolio size, institutions with portfolios above ₹5,000 crore account for ₹28,849 crore of equity, representing more than 70% of the sector’s total equity base. This is followed by institutions in the ₹2,000–5,000 crore category with ₹6,688 crore, while the ₹500–2,000 crore segment accounts for ₹3,089 crore. Smaller institutions have a relatively limited equity base, with ₹1,324 crore for the ₹100–500 crore category and ₹887 crore for institutions below ₹100 crore.
Figure 4.5.3: MLI Equity Outstanding - Yearly Trend and MLI-Category-wise Break-up of March 2026
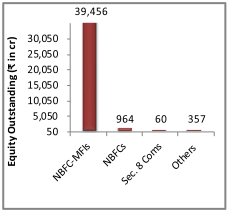
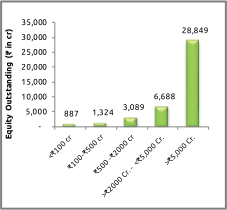
A similar concentration is evident across legal forms, with NBFC-MFIs accounting for the overwhelming majority of equity outstanding, while NBFCs1, Section 8 companies and other institutions hold comparatively small amounts. This concentration largely reflects NBFC-MFIs’ dominant share in the sector and their greater ability to attract institutional and external capital. Larger institutions’ stronger equity position gives them greater loss-absorption capacity, scope to leverage additional borrowings, and flexibility to support future portfolio growth. Conversely, the relatively smaller capital base of smaller MFIs may constrain their ability to scale and absorb periods of financial stress, highlighting the importance of strengthening diversified equity capital.
1 This analysis excludes some of the larger NBFCs like L&T and Bajaj, which have provided the self-reported data partially.
Fresh Equity Acquired
Equity mobilisation is an important indicator of the sector’s ability to attract fresh capital and strengthen its financial capacity. New equity gives institutions additional capital to support portfolio growth, absorb potential losses, meet regulatory requirements, and invest in technology, risk management, and operational infrastructure. Examining equity raised during the year, across legal forms and institutional size, provides insight into capital access, investor confidence and the capacity of different segments to support future growth.
Figure 4.5.4: Fresh Equity Raised by MLIs and MLI-Category-wise Break-up
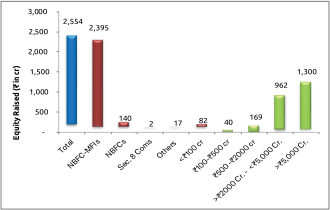
Equity raised in 2026 was ₹2,554 crore, with an overwhelming ₹2,395 crore (94%) mobilised by NBFC-MFIs, highlighting their dominant role in attracting fresh capital to the sector. NBFCs raised ₹140 crore, while Section 8 companies and other institutions together accounted for only a small share, which is expected as the nature of their operations more towards non-profit in nature. By portfolio size, equity mobilisation was strongly concentrated among larger institutions: entities with portfolios above ₹5,000 crore raised ₹1,300 crore, followed by those in the ₹2,000–5,000 crore category with ₹962 crore. Together, these two segments accounted for around 89% of total equity raised. In comparison, institutions below ₹2,000 crore collectively raised only ₹291 crore. This concentration suggests that larger institutions continue to have stronger access to equity capital, potentially supported by their scale, established track record, investor confidence and greater capacity to deploy additional capital. For smaller and mid-sized institutions, limited equity mobilisation may constrain their ability to strengthen capital buffers and expand portfolios, underscoring the importance of improving access to long-term and patient capital across the sector. In this regard, there is a need for public capital like IMEF in larger quantities. This will help the smaller institutions to grow bigger and become stronger to extend financial intermediation support to the poor.
4.5.2.iii Debt Funding
Since most of the MLIs are not allowed to mobilise deposits, debt funding becomes very important for microfinance operations. The funding structure of microfinance institutions is a key determinant of their liquidity, cost of funds and capacity to sustain lending operations. Given the sector’s reliance on external funding to support loan portfolios, the composition of liabilities provides insight into the extent of funding diversification and institutions’ access to different sources of finance. Examining the mix of borrowings, debt instruments, bonds, ECBs and other sources helps assess the sector’s funding resilience and ability to manage changing market conditions and funding costs.
Figure 4.5.5: Sources of funding based on types of instruments
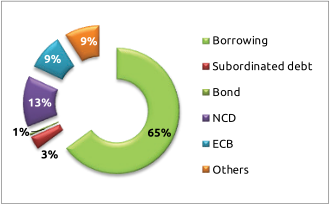
The funding structure indicates that borrowing from banks, DFIs and other financial institutions, remains the dominant source of external funding, accounting for 65% of total funds. This is followed by NCDs at 13%, while ECBs and other sources each contribute 9%. Subordinated debt accounts for 4%. This heavy reliance on borrowing highlights the sector’s continued dependence on bank and institutional finance to support lending operations. At the same time, the presence of ECBs, NCDs and other market-based instruments indicates some diversification of funding sources. A broader funding mix can help institutions manage liquidity and funding costs, although access to market-linked sources may vary significantly by institutional size and credit profile. Overall, the funding structure underscores the importance of diversifying liabilities and maintaining stable, cost-efficient sources of finance, particularly for smaller institutions that may have more limited access to capital markets.
The funding distribution by source indicates that the private sector is the largest provider of funds to microfinance institutions, accounting for 37% of total funding. This is followed by the public sector and other categories, contributing 15%, each. While NCDs account for 14%. NBFCs contribute a further 6%, with NABARD at 3%, MUDRA at 1%, and other financial institutions at 7%. SIDBI sources account for the remaining 2%.
Figure 4.5.6: Sources of funding based on Institution types
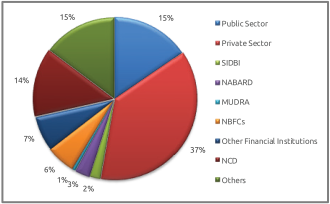
The composition reflects a diversified funding ecosystem, with both banks and financial institutions playing an important role alongside market-based debt instruments. The substantial private-sector contribution highlights the importance of commercial lenders in supporting microfinance operations. In contrast, the combined contribution of public-sector institutions and development-oriented lenders such as SIDBI and NABARD provides an important channel for institutional and potentially longer-term funding. The 14% share of NCDs also indicates growing relevance of market-based funding. Overall, the distribution suggests that the sector has access to multiple funding channels, which can help institutions manage liquidity and reduce dependence on any single source. At the same time, the dependence on borrowing still very high and the sector need to move into other market instruments to have better access to funding without relying on borrowing.
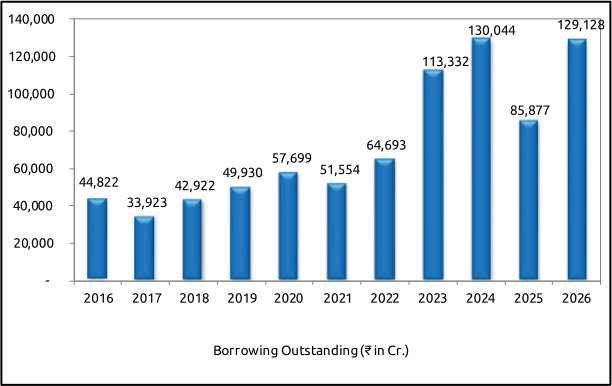
Borrowing outstanding has expanded substantially over the past decade, rising from ₹44,822 crore in 2016 to ₹1,29,128 crore in 2026. After a decline to ₹33,923 crore in 2017, borrowings increased steadily through 2020, with a temporary moderation in 2021. The pace of growth accelerated significantly thereafter, reaching ₹1,13,332 crore in 2023 and peaking at ₹1,30,044 crore in 2024. Borrowings fell sharply to ₹85,877 crore in 2025, then recovered strongly in 2026 to ₹1,29,128 crore, a 50.4% year-on-year increase.
The recovery of microlending towards the end of FY 2026 reflects on the renewed access to external funding following the contraction observed in 2025. The introduction of Credit Guarantee Scheme for MFI 2.0 in March 2026, may not have been made use of in FY 2026. But provide a positive sentiment to the funders.
The near return to the 2024 peak also suggests institutions have rebuilt their borrowing capacity to support lending operations and liquidity requirements. This trend aligns with the broader recovery in the sector’s outstanding portfolio and indicates continued reliance on external borrowings as the principal source of funding. At the same time, significant year-to-year fluctuations highlight the importance of maintaining diversified, stable funding channels to manage liquidity and funding-cost risks.
Figure 4.5.7: Outstanding Borrowings (₹ in Cr.) – Yearly Trend and MLI-Category-wise Break-up of 2026
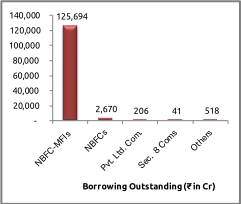
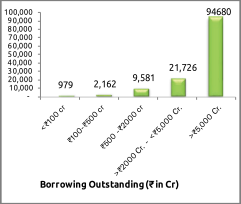
The distribution of borrowing outstanding in 2026 shows a strong concentration among NBFC-MFIs and the largest institutions. By legal form, NBFC-MFIs account for ₹1,25,694 crore, representing the overwhelming majority of total borrowings, while NBFCs account for ₹2,670 crore and other legal forms contribute relatively small amounts. By portfolio size, institutions with portfolios above ₹5,000 crore hold ₹94,680 crore of borrowings, followed by the ₹2,000–5,000 crore category at ₹21,726 crore and the ₹500–2,000 crore category at ₹9,581 crore. Together, institutions ‘above ₹2,000 crore’ account for most outstanding borrowings.
This concentration reflects larger MLIs’ scale of operations and greater access to institutional funding. Larger institutions are likely to have stronger credit profiles, established lender relationships and greater ability to access diverse funding instruments. In contrast, smaller institutions have significantly lower outstanding borrowings, which may reflect smaller portfolios and comparatively limited access to large-scale institutional finance. The distribution also reinforces the sector’s dependence on NBFC-MFIs as the principal borrowers and highlights the need to diversify funding and improve access to competitive finance for smaller and mid-sized institutions.
Borrowing Received
The microfinance sector received ₹1,07,081 crore by way of borrowings during FY 2026, with NBFC-MFIs accounting for ₹1,05,208 crore, or nearly 98% of total borrowing received. NBFCs received ₹1,553 crore, while other legal forms accounted for relatively small amounts. The concentration is similarly pronounced by institutional size, with institutions having portfolios above ₹5,000 crore receiving ₹86,532 crore, followed by the ₹2,000–5,000 crore category at ₹12,789 crore and the ₹500–2,000 crore category at ₹6,391 crore.
Figure 4.5.8: Fund Received during the year and MLI-Category-wise Break-up of 2026
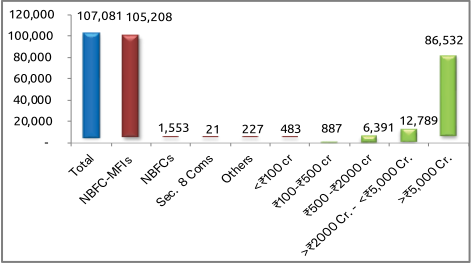
The distribution indicates that larger institutions continue to attract most fresh debt funding, reflecting that the small and medium ones have still to gain the confidence of the funders. The CGSMFI 2.0 is likely to change this sentiment. The strong concentration of borrowing among larger NBFC-MFIs also reflects the sector’s structure, where these institutions account for most lending activity. Overall, the data indicate strong mobilisation of debt funding in FY 2026, while highlighting the continuing need to broaden access to stable and competitively priced debt for smaller and mid-sized institutions.
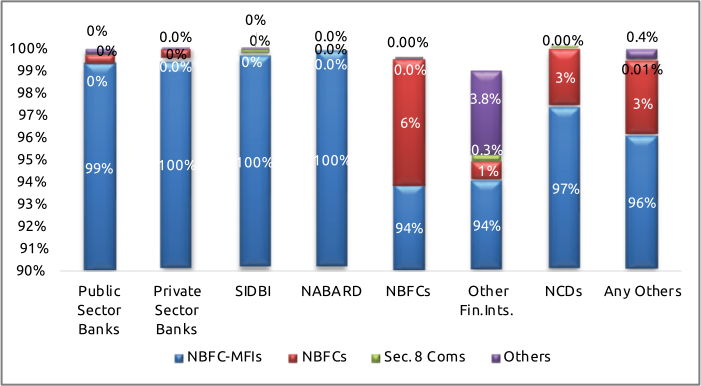
Table 4.5.1 and Figure 4.5.9 below illustrate the debt received by MLIs from various source types.
Table 4.5.1: Source wise fund received (in ₹ Cr.) by different entities during the year
| Public Sector Banks | Private Sector Banks | SIDBI | NABARD | NBFCs | Other Fin. Ints. | NCDs | Any Others | |
|---|---|---|---|---|---|---|---|---|
| NBFC-MFIs | 15,893 | 51,548 | 1,214 | 1,558 | 7,075 | 2,643 | 7,366 | 17,910 |
| NBFCs | 70 | 220 | - | - | 421 | 23 | 194 | 626 |
| Pvt. Ltd. Com. | 2 | 1 | - | - | 37 | 27 | - | 5 |
| Sec. 8 Coms | 8 | - | 2 | - | 1 | 8 | 0.20 | 1 |
| Others | 37 | 4 | 0.25 | - | 0.30 | 107 | - | 79 |
| Total | 16,010 | 51,773 | 1,217 | 1,558 | 7,535 | 2,808 | 7,560 | 18,621 |
Figure 4.5.9 : Source-wise Share of Loans lent among Different Legal Forms of MLIs during 2025-26
Major lenders to MLIs during 2025-26
The tables below list the major lenders (based on the information received for the top 10 lenders for each institution) that provide debt funds to MLIs.
Table 4.5.2 (a): List of banks that lent to MLIs as of March 2026 (Based on the Top 10 lenders out of the total)
| Sl. No. | Name of Lenders | No. of MLIs |
|---|---|---|
| 1 | Assam Cooperative Apex Bank (ACAB) | 1 |
| 2 | Assam Gramin Vikash Bank | 1 |
| 3 | AU Small Finance Bank | 3 |
| 4 | Axis Bank Ltd. | 10 |
| 5 | Bandhan Bank Ltd. | 8 |
| 6 | Bank of Baroda | 10 |
| 7 | Bank of Maharashtra | 6 |
| 8 | Canara Bank | 2 |
| 9 | City Union Bank | 1 |
| 10 | CSB Bank Ltd. | 1 |
| 11 | DBS Bank India Ltd. | 2 |
| 12 | DCB Bank Ltd. | 4 |
| 13 | District Central Co-operative Bank | 1 |
| 14 | Equitas Small Finance Bank | 1 |
| 15 | ESAF Small Finance Bank | 1 |
| 16 | Federal Bank Ltd. | 7 |
| 17 | HDFC Bank Ltd. | 3 |
| 18 | HSBC Bank Ltd. | 7 |
| 19 | ICICI Bank Ltd. | 8 |
| 20 | IDBI Bank Ltd. | 4 |
| 21 | IDFC First Bank Ltd. | 18 |
| 22 | Indian Bank | 1 |
| 23 | Indian Overseas Bank | 7 |
| 24 | IndusInd Bank Ltd. | 2 |
| 25 | Jana Small Finance Bank | 6 |
| 26 | Karur Vysya Bank | 3 |
| 27 | Kotak Mahindra Bank Ltd. | 2 |
| 28 | NABARD | 1 |
| 29 | NE Small Finance Bank | 1 |
| 30 | Pudhuvai Bharathiyar Grama Bank | 1 |
| 31 | Punjab & Sind Bank | 1 |
| 32 | RBL Bank Ltd. | 3 |
| 33 | REPCO Bank | 1 |
| 34 | SBM Bank Ltd. | 2 |
| 35 | Shivalik Small Finance Bank | 1 |
| 36 | SIDBI | 9 |
| 37 | Standard Chartered Bank | 4 |
| 38 | State Bank of India | 21 |
| 39 | State Bank of Mauritius | 2 |
| 40 | Suryoday Small Finance Bank | 1 |
| 41 | Tamil Nadu Grameen Bank | 1 |
| 42 | The Assam Co-operative Apex Bank Ltd. | 1 |
| 43 | UCO Bank Ltd | 4 |
| 44 | Union Bank of India | 9 |
| 45 | West Bengal Gramin Bank | 2 |
| 46 | Yes Bank Ltd. | 6 |
Table 4.5.2 (b): List of other lenders who lent to MLIs as of March 2026 (Based on the Top 10 lenders out of the total)
| Sl. No. | Name of Lenders | No. of MLIs |
|---|---|---|
| 1 | AK Capital Services Ltd. | 1 |
| 2 | Ambium Finserve Pvt. Ltd. | 1 |
| 3 | Annapurna Finance Pvt. Ltd. | 4 |
| 4 | Archbridge Capital Pvt. Ltd. | 1 |
| 5 | Arohan Financial Services Ltd. | 20 |
| 6 | Assam Finance Corporation (AFC) | 4 |
| 7 | Asvanta Financial Consultants Pvt. Ltd. | 2 |
| 8 | Aurukshaya Consultants Pvt. Ltd. | 1 |
| 9 | Avanti Finance Pvt. Ltd. | 2 |
| 10 | Baid Finserv Ltd. | 2 |
| 11 | Bajaj Finance Ltd. | 1 |
| 12 | Barclays Bank PLC | 1 |
| 13 | Blacksoil Capital Pvt. Ltd. | 3 |
| 14 | Blue Orchard Microfinance Fund | 2 |
| 15 | Carron Capital LLP | 1 |
| 16 | Caspian Investments Pvt. Ltd. | 1 |
| 17 | Concard Financiers Pvt. Ltd. | 1 |
| 18 | Creation Investments Capital Management | 1 |
| 19 | Electronica Finance Ltd. | 1 |
| 20 | Finstars Capital Ltd. | 1 |
| 21 | Floras | 1 |
| 22 | FMO | 1 |
| 23 | Fuherer Capital Pvt. Ltd. | 1 |
| 24 | FWWB | 18 |
| 25 | Global Gender Smart Fund (Incofin) | 1 |
| 26 | Godavari Urban Multistate Credit Co-operative Society | 1 |
| 27 | Gosree Finance | 1 |
| 28 | Grip Invest Technologies Pvt. Ltd. | 3 |
| 29 | Hero FinCorp Ltd. | 1 |
| 30 | Hindon Mercantile Ltd. | 1 |
| 31 | Hinduja Leyland Finance | 1 |
| 32 | IBL Finance Ltd. | 3 |
| 33 | IFMR Fimpact | 1 |
| 34 | IIX Global | 1 |
| 35 | InCred Financial Services Ltd. | 2 |
| 36 | Infina Finance Pvt. Ltd.(IFPL) | 1 |
| 37 | IRIS | 1 |
| 38 | Jackson Commercial Pvt. Ltd. | 1 |
| 39 | Janasha Finance Pvt. Ltd. | 1 |
| 40 | Jeevan Utthan Financial Services Pvt. Ltd. | 2 |
| 41 | Kaleidofin Capital Pvt. Ltd. | 4 |
| 42 | Kamdhenu Financial Services Pvt. Ltd. | 1 |
| 43 | Karnataka State Financial Corporation | 1 |
| 44 | Kashi Vishwanatha Vidya Samasthe | 1 |
| 45 | Kiara Microcredit | 1 |
| 46 | Kissandhan Agri Financial Services Pvt. Ltd. | 2 |
| 47 | Kiyansh Finance Pvt. Ltd. | 2 |
| 48 | Kula International | 1 |
| 49 | Lord Fincap Ltd. | 1 |
| 50 | Maanaveeya Development & Finance Pvt. Ltd. | 6 |
| 51 | Manappuram Finance Ltd | 1 |
| 52 | MAS Financial Services Ltd. | 13 |
| 53 | Microfinance Solidaire | 1 |
| 54 | MILAAP | 3 |
| 55 | Money Wise Financial Services Pvt. Ltd. | 2 |
| 56 | Moringway | 1 |
| 57 | Mufin Green Finance Ltd. | 1 |
| 58 | Muthoot Microfin Ltd. | 1 |
| 59 | NABFINS Ltd. | 3 |
| 60 | NABKISAN Finance Ltd. | 2 |
| 61 | Naman Finlease Ltd. | 1 |
| 62 | National Cooperative Development Corporation (NCDC) | 2 |
| 63 | NEDFi | 7 |
| 64 | Neo Markets Services Pvt. Ltd. | 1 |
| 65 | Nipha Finance Pvt. Ltd. | 1 |
| 66 | NKC Finance Pvt. Ltd. | 2 |
| 67 | Northern Arc Capital Ltd. | 13 |
| 68 | Nova Vyapar Pvt. Ltd. | 1 |
| 69 | OXY Venture | 1 |
| 70 | Oxyzo Financial Services Ltd. | 3 |
| 71 | PAFT Finance Ltd. | 1 |
| 72 | Pagasa Consultancy Pvt.Ltd. | 1 |
| 73 | Phillip Capital | 1 |
| 74 | Pinoy Consultancy Pvt. Ltd. | 1 |
| 75 | Piramal Finance Ltd. | 4 |
| 76 | Rajputana Investment and Finance Ltd. | 1 |
| 77 | RAR Fincare Ltd | 7 |
| 78 | Real Touch Finance Ltd. | 1 |
| 79 | ResponsAbility | 1 |
| 80 | Rockland Finstock Ltd. | 1 |
| 81 | Sabrimala Fintech Pvt. Ltd. | 2 |
| 82 | Sahabhagi Services Pvt. Ltd. | 1 |
| 83 | Saidhan Mercantile Pvt. Ltd. | 1 |
| 84 | Samunnati Services Pvt.Ltd. | 1 |
| 85 | SAS Finserv Pvt. Ltd. | 1 |
| 86 | Satin Creditcare Network Ltd. | 1 |
| 87 | SAVE Solutions Pvt. Ltd. | 1 |
| 88 | Share Bazar Financial Pvt. Ltd. | 1 |
| 89 | Shine Star Build Cap Pvt. Ltd. | 2 |
| 90 | Shriram Finance Ltd. | 11 |
| 91 | SK Finance Ltd. | 1 |
| 92 | SV Creditline Ltd. | 1 |
| 93 | Tamilnadu Industrial Investment Corporation (TIIC) Ltd. | 1 |
| 94 | Tata Capital Ltd. | 3 |
| 95 | The Kangra Central Co-op Bank Ltd. | 1 |
| 96 | Tipsons Consultancy Services Pvt. Ltd. | 1 |
| 97 | Triodos Investment Management BV | 1 |
| 98 | Tuvis Services | 1 |
| 99 | UC Inclusive Credit Pvt.Ltd. | 9 |
| 100 | Usha Financial Services Pvt. Ltd | 8 |
| 101 | UTI Responsibility | 1 |
| 102 | Viridian Capital and Financial Services Pvt. Ltd. | 2 |
| 103 | Vivriti Capital Pvt. Ltd. | 10 |
| 104 | Western Capital Advisors Pvt. Ltd. | 1 |
| 105 | Wint Wealth | 1 |
| 106 | WLB Asset Vii PTE Ltd . | 1 |
4.5.3 Capital to Risk Weighted Asset Ratio
The trend shows a significant increase in the indicator from 2018 to 2026, rising from 22.1% to 40.23%. After remaining broadly stable around 21–23% during 2018–20, it increased sharply to 28.41% in 2021. The ratio then moderated slightly during 2022–24, remaining in the range of 26.47–28.00%, before accelerating to 32.94% in 2025 and reaching 40.23% in 2026.
Figure 4.5.10: Capital to Risk-Weighted Asset Ratio
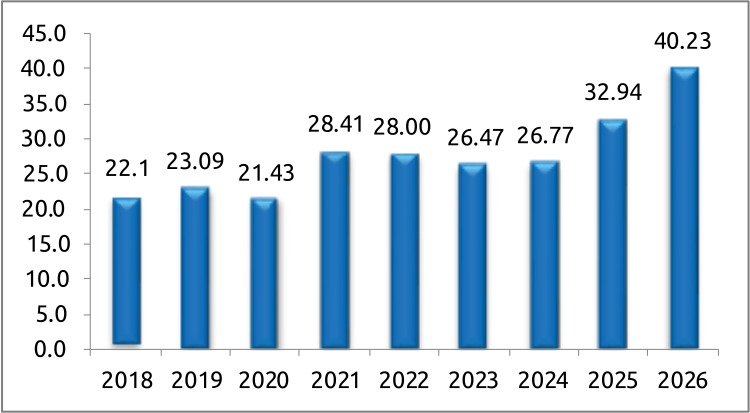
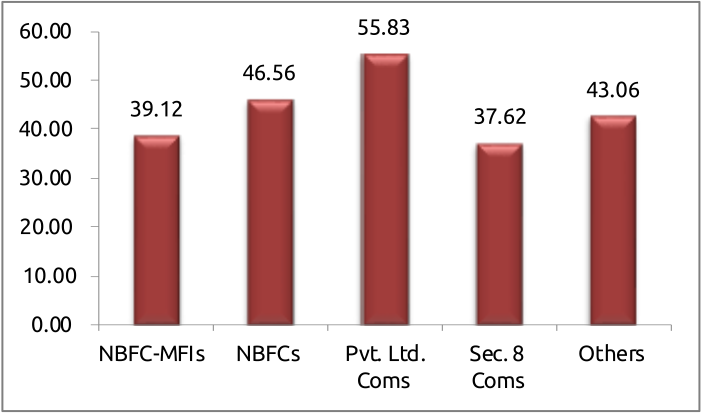
The sharp increase in the ratio from 32.94% in 2025 to 40.23% in 2026 can be viewed in the context of the sector’s changing balance-sheet dynamics during FY2025–26. The increase was broadly driven by contraction in the loan portfolio alongside a strengthening of the equity base. As portfolio size moderated, equity’s relative weight in the overall financial structure increased. At the same time, the sector could also mobilise significant fresh equity amounting to ₹2,554 crore in FY 2026.
This combination of a reduced portfolio and increased equity resulted in a northward movement of the ratio. The movement therefore reflects a change in the denominator and capital strengthening by institutions. But this trend was concentrated mostly in larger NBFC-MFIs.
4.5.4 Leverage / Debt – Equity Ratio
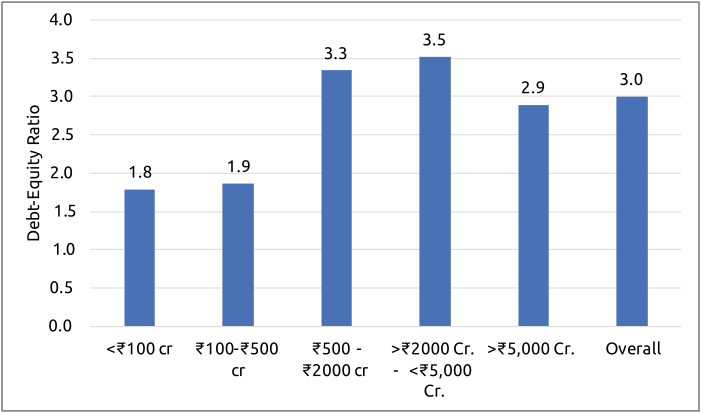
The Debt-Equity ratio measures the extent to which MFIs finance their assets through borrowed funds compared to shareholders’ equity. Since MFIs primarily operate by mobilising debt from banks, NBFCs, and capital markets, a higher ratio reflects greater reliance on external borrowings. While leveraging debt helps expand outreach and scale loan portfolios quickly, excessive dependence on debt increases financial risk and vulnerability to interest rate fluctuations. Regulators and lenders often prescribe prudent debt-equity thresholds to ensure stability. Figure 4.5.11 depicts the weighted-average Debt-Equity ratio across segments.
Figure 4.5.11: Debt-Equity Ratio for All MLIs and Break–up of FY 2025-26 across MLI – Categories
Conclusion
The analysis of the sector’s capital and funding structure highlights a significant strengthening of microfinance institutions’ financial base in FY 2026. While the sector predominantly relies on borrowings to support its lending operations, the year also witnessed quite a significant equity mobilisation, with ₹2,554 crore of fresh equity raised. This strengthened institutions’ capital position at a time when portfolio growth has moderated.
Funding remains highly concentrated among NBFC-MFIs and larger institutions, which continue to have greater access to debt and equity capital. The increase in the equity-to-asset position during FY 2026 reflects the combined effect of portfolio contraction and stronger equity mobilisation, indicating a more capitalised balance sheet.
Overall, funding trends suggest a shift toward greater capital resilience and financial consolidation, although access to stable, competitively priced funding remains more constrained for smaller and mid-sized institutions. Going forward, diversifying funding sources, expanding access to long-term capital, and prudent leverage management will be important to support sustainable portfolio growth while maintaining financial resilience.