


Chapter 4Operational Eminence of Micro Lending Institutions
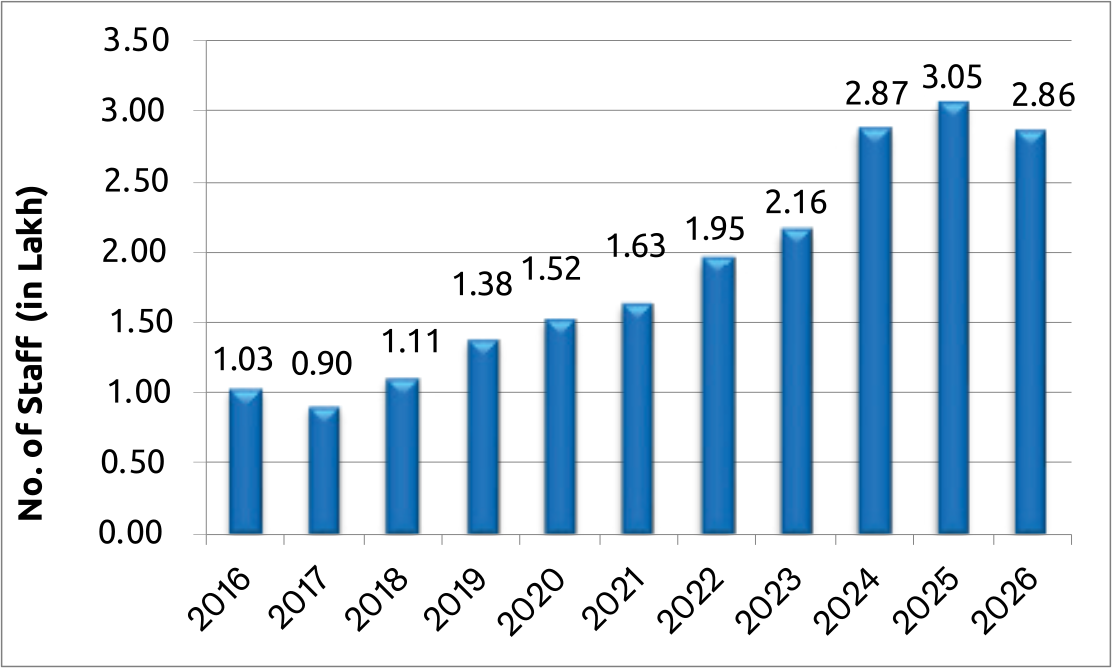
In line with the sector’s guided deceleration, we observed a contraction in the workforce, from 3.05 lakh in FY2024-25 to 2.86 lakh in FY2025-26. The new recruitment eased, from 2.06 lakh new hires to 1.53 lakh. This aligns with the sector’s overall deceleration, with the portfolio level declining by 11%.


Chapter 4: Section I
Operational Eminence of Micro Lending Institutions
4.1 Productivity of Workforce:
4.1.1 Workforce in MLIs
In line with the sector’s guided deceleration, we observed a contraction in the workforce, from 3.05 lakh in FY2024-25 to 2.86 lakh in FY2025-26. The new recruitment eased, from 2.06 lakh new hires to 1.53 lakh. This aligns with the sector’s overall deceleration, with the portfolio level declining by 11%.
Although the staff numbers have reduced, the borrowers per staff member held almost steady at 195, essentially unchanged from last year, showing that overall service capacity per employee has been preserved even as the workforce itself got leaner.
A smaller, more deliberately built workforce, hired more selectively, with ABS holding firm, suggests MLIs are prioritising the right people over sheer headcount, which typically follows periods of rapid growth. Digitisation, along with AI-enabled tools, has already begun reshaping employees’ workflows. The flat ABS trend is consistent with technology helping hold the line on overall productivity even as workforce count fell.
Staff strength stood at 2.86 lakh in 2026, down about 6% from the peak of 3.05 lakh in 2025. This moderation likely reflects workforce rationalisation and operational consolidation following the rapid expansion seen in 2024–25. Slower portfolio growth, tighter underwriting and responsible lending practices, and greater adoption of digital processes and technology-enabled collections and customer servicing may have reduced the need for additional field-level manpower. The moderation also coincides with easing input costs for lenders; inflation has stayed comfortably within the RBI’s target range through FY2025-26, allowing institutions to prioritise balance-sheet repair and workforce efficiency over aggressive branch and headcount expansion. Despite the decline, the workforce remains significantly higher than in earlier years, indicating continued operational capacity across the sector.
Figure 4.1.1: Number of MLI staff – Yearly trend and MLI-category-wise Break-up of current year
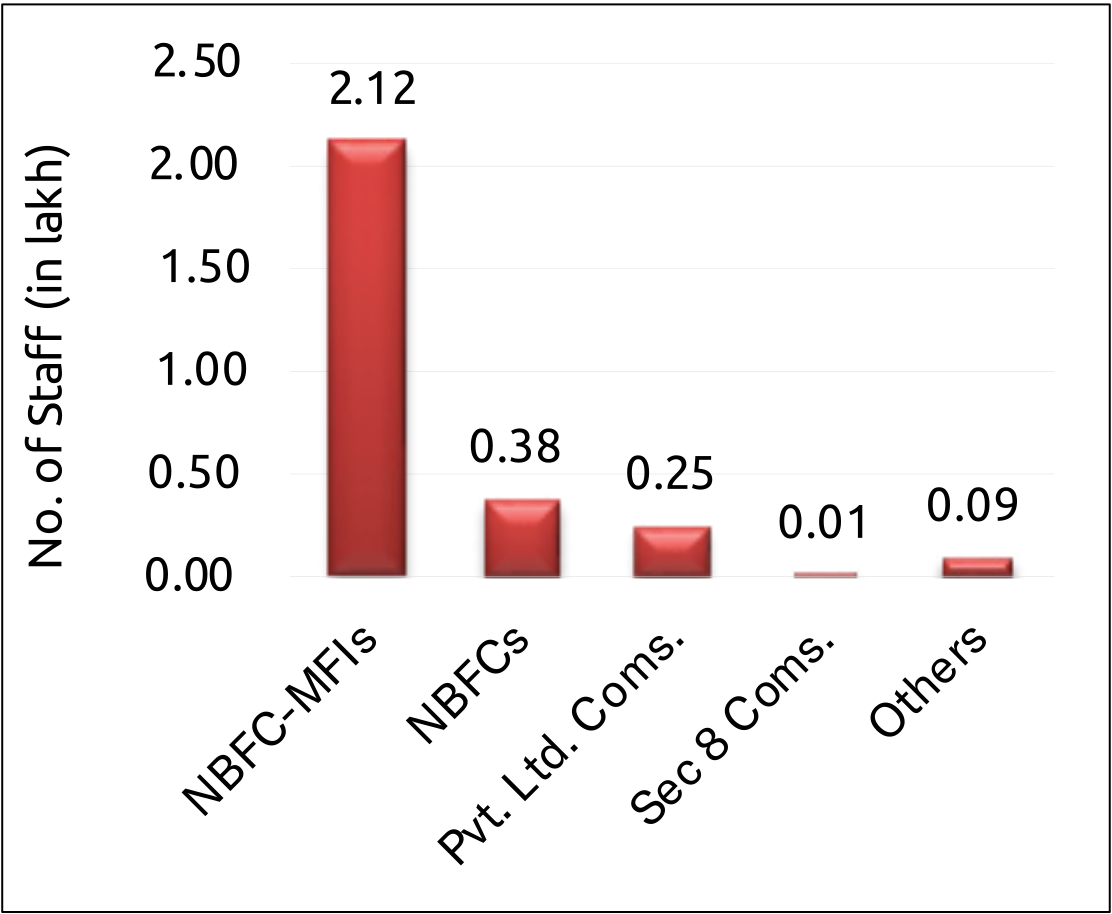
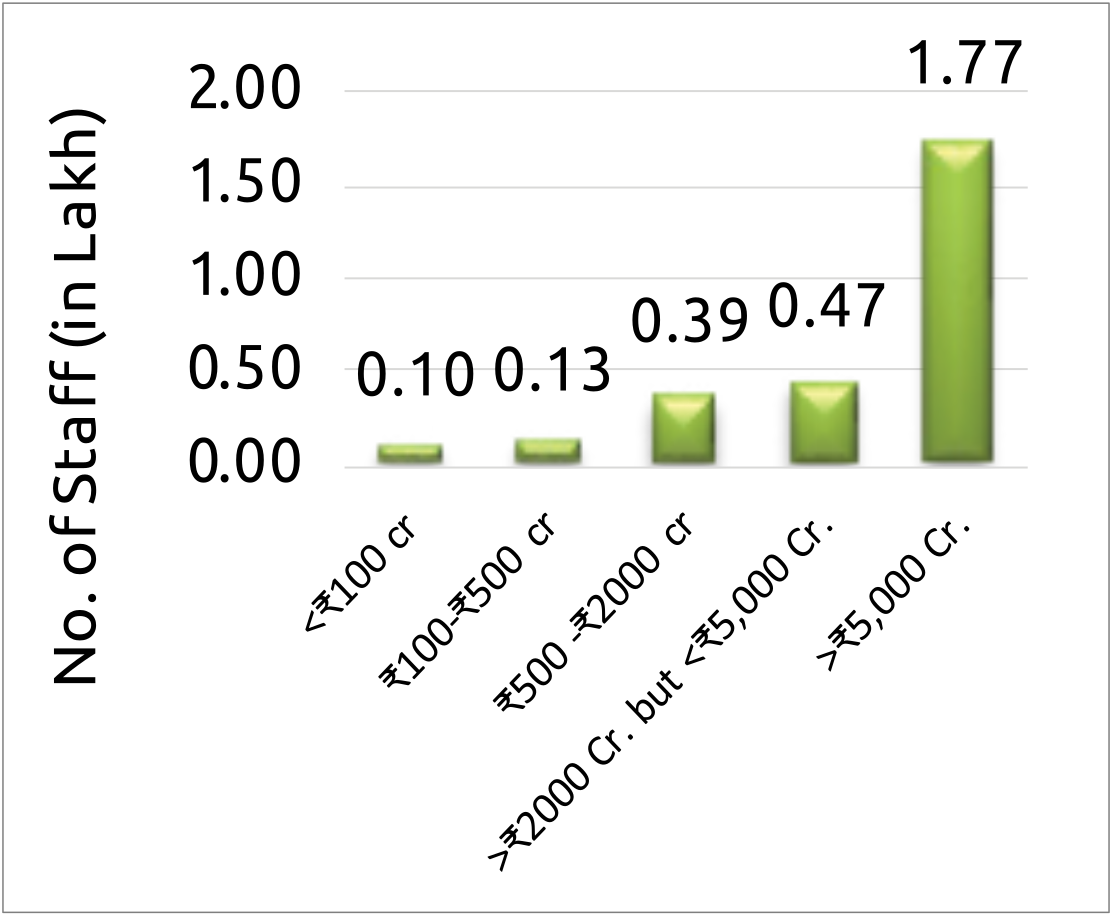
Among MLIs, in 2026, staff strength is predominantly concentrated among NBFC-MFIs, which account for 2.12 lakh staff, far exceeding NBFCs (0.38 lakh), private limited companies (0.25 lakh), and other lender categories. Within NBFC-MFIs, larger institutions employ a much larger share of the workforce: institutions with a ₹2,000–5,000 crore portfolio account for 0.47 lakh staff, followed by those with ₹500–2,000 crore at 0.39 lakh. Smaller institutions employ fewer staff, suggesting that workforce size closely aligns with institutional scale and portfolio size. At the macro level, this concentration of employment within NBFC-MFIs and larger institutions mirrors the wider formalisation of India’s financial system1. While larger lenders benefit from economies of scale and can support more structured employment, this also underscores the need to ensure that smaller MFIs remain financially sustainable and operationally viable, particularly as the sector focuses on cost efficiency and digital transformation. Overall, a large and skilled workforce continues to underpin financial inclusion, employment generation, and last-mile delivery of financial services, particularly in rural and underserved markets that remain outside the reach of mainstream banking.
As the sector evolves toward more responsible and efficient lending, changes in workforce size and composition offer important insights into microfinance institutions’ operational priorities — and, by extension, into the health of last-mile credit delivery across the wider economy. The following analysis examines the overall staff strength, distribution across lender categories and institution sizes, and the changing composition of frontline and support staff in 2026.
1 Based on the self-reported data of MLIs.
Figure 4.1.2: Distribution of staff in the last two years
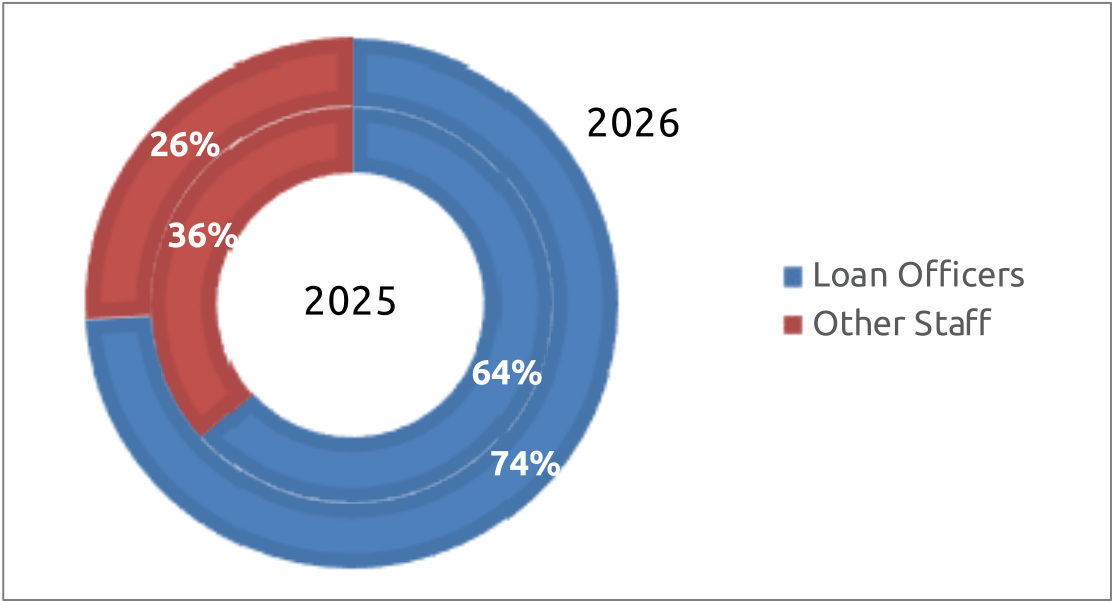
The workforce composition shows a clear shift towards Loan Officers (field officers), whose share increased from 64% in 2025 to 74% in 2026, while the share of other staff declined from 36% to 26%. This points to a more efficient utilization of manpower with focus on field-level lending and customer-facing operations, consistent with the sector’s growing emphasis on credit monitoring, collections, borrower engagement and responsible lending. The shift also indicates a rationalisation of support functions and greater operational efficiency through technology and digitalisation — institutions are visibly prioritising frontline roles that directly support portfolio management and customer outreach over back-office headcount, a pattern that aligns with the Usage-led rise in the RBI’s national Financial Inclusion Index this year.
Women’s participation in the microfinance workforce is an important indicator of the sector’s contribution to inclusive employment and gender diversity. Given the sector’s strong focus on women borrowers and community-level engagement, women’s presence in the workforce is particularly relevant — and worth reading against the national trend, where female labour force participation has been rising steadily. The following analysis examines the trend in women’s employment and their share of total staff strength over the years, with a focus on developments in 2026.
Table 4.1.1: Year-wise staff strength in MLIs and share of women staff
| Year | Total Staff (in lakh) | Women Staff (in lakh) | % of Women Staff to Total Staff |
|---|---|---|---|
| 2016 | 1.03 | 0.16 | 15% |
| 2017 | 0.90 | 0.11 | 12% |
| 2018 | 1.11 | 0.13 | 12% |
| 2019 | 1.38 | 0.16 | 12% |
| 2020 | 1.52 | 0.17 | 11% |
| 2021 | 1.63 | 0.17 | 10% |
| 2022 | 1.95 | 0.25 | 13% |
| 2023 | 2.16 | 0.26 | 12% |
| 2024 | 2.87 | 0.31 | 11% |
| 2025 | 3.05 | 0.31 | 10% |
| 2026 | 2.86 | 0.31 | 11% |
The data indicate that women’s participation in the microfinance workforce has remained relatively stable in absolute terms but has declined as a share of total employment over the longer term. Women staff increased from 0.16 lakh in 2016 to 0.31 lakh in 2026, while their share of total staff declined from 15% in 2016 to 11% in 2026, reaching a low in the share of 10% in 2025. In 2026, despite an overall reduction in staff strength from 3.05 lakh to 2.86 lakh, the number of women staff remained unchanged at 0.31 lakh, lifting their share back up to 11%. This suggests that women’s attrition has been relatively low and their recruitment has also been stagnant. In other words, for the last 3 years, the number has been almost stable at 0.31 lakh, indicating there has not been much expansion in their strength in microfinance. This is in contrast with the MoSPI’s Periodic Labour Force Survey, which shows the rural female labour force participation rate stood at 45.9% in 2025. For a sector whose entire lending model is built around women borrowers, expanding women’s presence in frontline and managerial roles would not only align the workforce more closely with the client base but also provide better business sense to micro lenders.
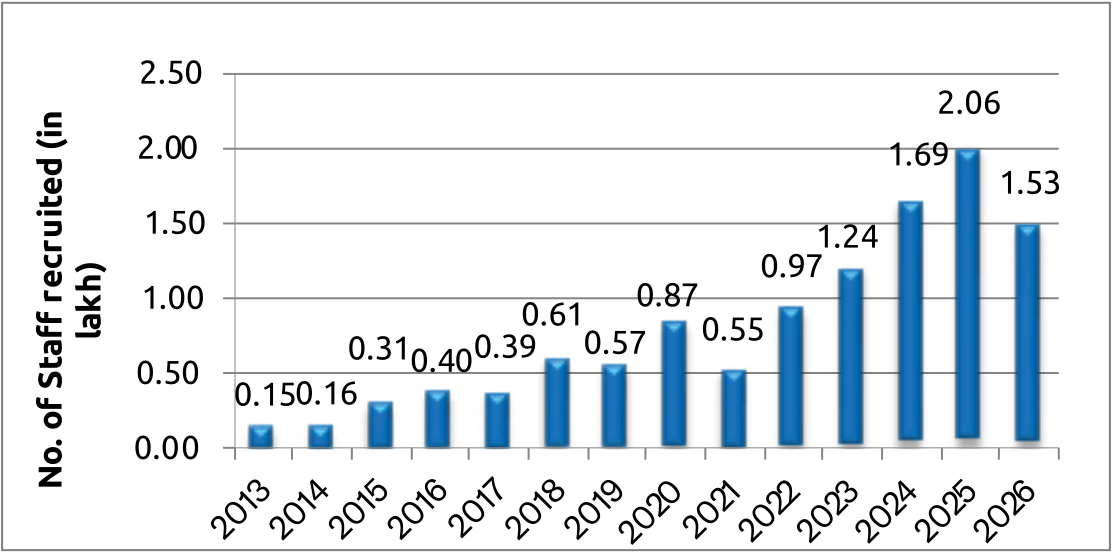
Staff recruitment in the microfinance sector has shown a strong overall upward trend over the past decade, although with periodic fluctuations that broadly track the sector’s own credit cycle. Recruitment increased from just 0.15 lakh in 2013 to 0.40 lakh in 2016, before rising significantly to 0.61 lakh in 2018. After a temporary moderation in 2019, recruitment reached 0.87 lakh in 2020, then fell to 0.55 lakh in 2021, largely reflecting pandemic-related operational and business disruptions. Recruitment subsequently recovered strongly, increasing from 0.97 lakh in 2022 to 1.24 lakh in 2023, and accelerated further to 1.69 lakh in 2024 and 2.06 lakh in 2025.
The sharp increase between 2023 and 2025 is consistent with the sector’s expansion in portfolio, customer outreach and operational footprint, alongside greater staffing requirements for field operations, collections, credit assessment, customer servicing and compliance. This period also coincided with a strong national growth cycle — real GDP grew 6.5% in FY2024-25 — which supported buoyant credit demand and gave MLIs the confidence to scale up staffing well ahead of the eventual correction. Strong recruitment during this period may also reflect institutions rebuilding and strengthening their workforce following pandemic-related disruptions.
In 2026, recruitment moderated to 1.53 lakh, down by about 26% from the previous year’s peak. This reduction appears consistent with the deceleration of business observed in 2026, driven by slower portfolio growth, tighter lending practices, branch and workforce rationalisation, and increased use of digital technologies in lending and collections.
Figure 4.1.3: New Staff Recruitment and their break-up based on Legal Form and Size
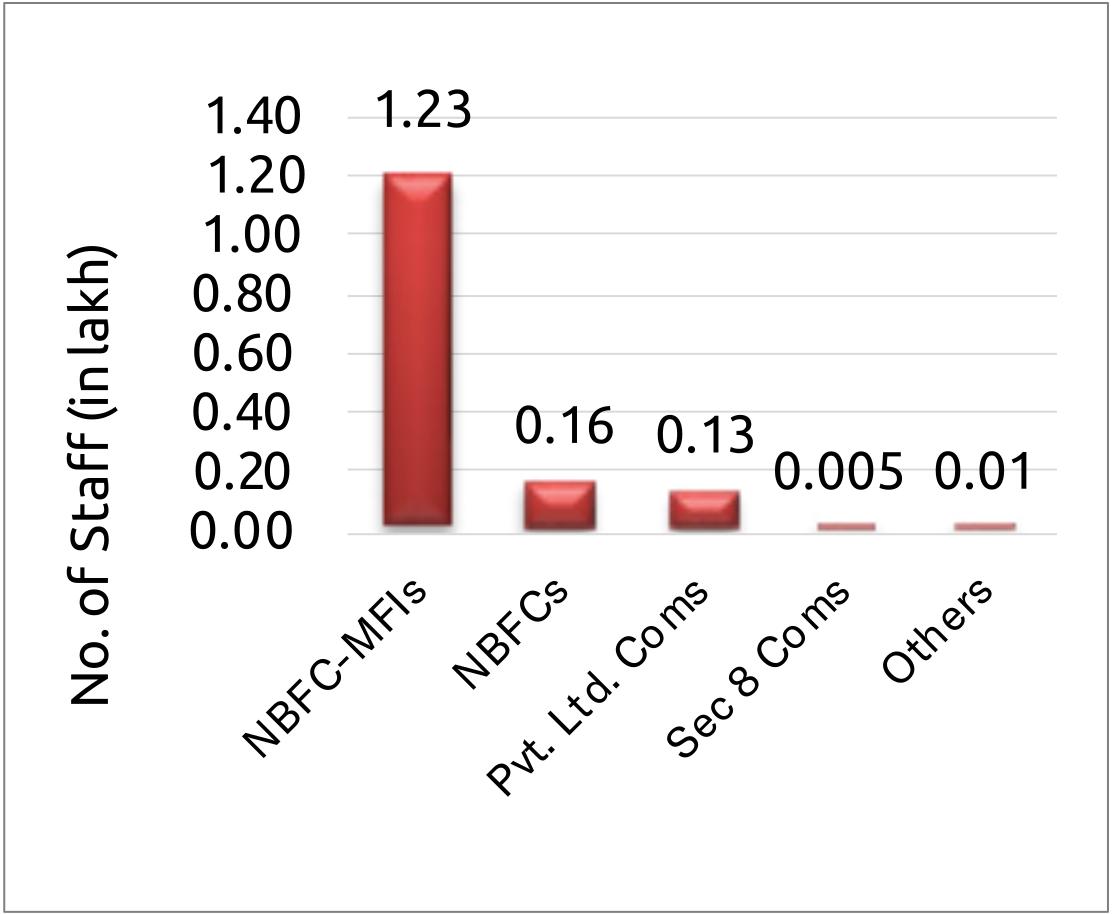
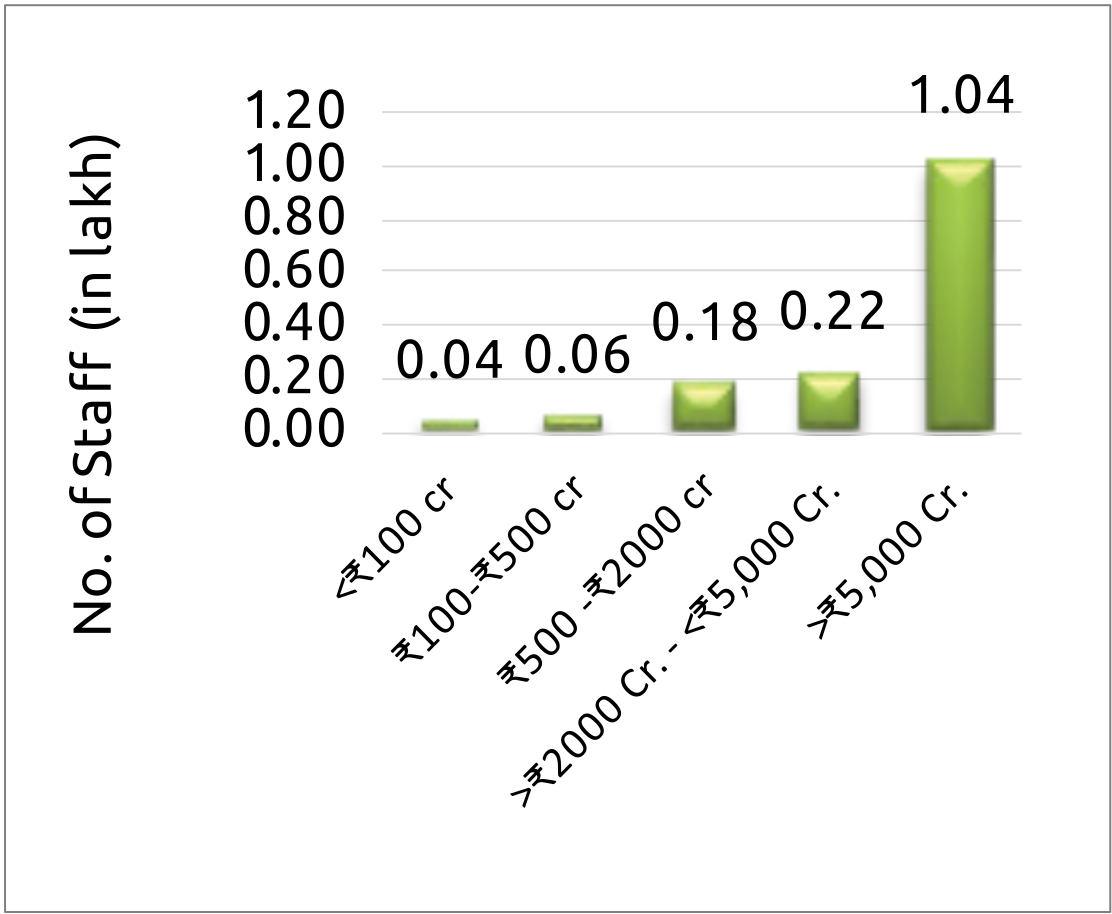
In FY2025-26, staff recruitment was heavily concentrated among NBFC-MFIs, which accounted for 1.23 lakh of the 1.53 lakh total recruits. Recruitment was particularly strong among larger institutions, with entities having portfolios above ₹5,000 crore accounting for 1.04 lakh recruits, substantially higher than smaller portfolio-size categories. This concentration reflects the greater scale of operations and workforce requirements of large NBFC-MFIs, and reinforces a broader pattern visible across the year: employment generation in the sector is increasingly a function of institutional scale rather than sector-wide growth, with smaller institutions contributing relatively modestly to overall employment generation during the year.
As seen in the previous years, in 2025–26 staff movement indicates considerable workforce churn across the microfinance sector, with 1.72 lakh staff exiting as against 1.53 lakh new recruits, resulting in a net decline of around 19,000 staff during the year. Attrition was particularly pronounced among NBFC-MFIs, which accounted for nearly 81% of total staff exits, while recruitment also remained concentrated in this segment. By business size, the largest institutions (portfolios above ₹5,000 crore) recorded the highest employee movement, with over 1.02 lakh exits and 1.04 lakh new recruits; recruitment marginally exceeded exits, however, resulting in a net addition of around 1,400 staff. In contrast, institutions in the ₹2,000–5,000 crore category saw a notable workforce reduction, as exits substantially exceeded new recruitment. Overall, the data suggest that 2025–26 was a year of workforce rationalisation and restructuring, with larger institutions largely maintaining their workforce through replacement hiring, while smaller and mid-sized institutions experienced greater net reductions — a bifurcation that echoes the broader consolidation pattern visible across India’s NBFC space, where scale and access to capital have increasingly determined which institutions can absorb stress without shedding jobs.
Table 4.1.2: Staff Attrition across different categories during FY 2025-26
| Categories of institutions based on legal status and size of business | No. of staff at the beginning of the year (i.e., April’25) | No. of staff who left/dropped during the year. | No. of new Staff recruited during the year | No. of staff at the end of the year (i.e. March 26) |
|---|---|---|---|---|
| Staff Attrition across Legal Form of MLIs | ||||
| NBFC-MFIs | 2,28,679 | 139179 | 122693 | 2,12,193 |
| NBFCs | 37,655 | 15661 | 16216 | 38,210 |
| Pvt. Ltd. Coms | 27,550 | 15426 | 12849 | 24,973 |
| Sec. 8 Coms | 1,300 | 630 | 480 | 1,150 |
| Other NGO-MFIs | 9,815 | 922 | 556 | 9,449 |
| Total | 3,04,999 | 1,71,818 | 1,52,794 | 2,85,975 |
| Staff Attrition across Size of MLIs | ||||
| <₹100 Cr. | 13,595 | 7,000 | 3,644 | 10,239 |
| ₹100 Cr.- ₹500 Cr. | 13,723 | 6,666 | 5,634 | 12,691 |
| ₹500 Cr. – ₹2000 Cr. | 42,350 | 21,342 | 17,833 | 38,841 |
| >₹2000 Cr. - <₹5,000 Cr. | 59,481 | 34,601 | 22,087 | 46,967 |
| >₹5,000 Cr. | 1,75,850 | 1,02,209 | 1,03,596 | 1,77,237 |
| Total | 3,04,999 | 1,71,818 | 1,52,794 | 2,85,975 |
4.1.2 Staff Productivity
Staff productivity remains an important measure of the operational efficiency, cost-effectiveness and service delivery capacity of microfinance institutions. Given the sector’s field-intensive operating model, institutions must effectively manage their workforce while maintaining meaningful engagement with borrowers to support both portfolio quality and institutional sustainability. Productivity is particularly relevant in the current environment, where lenders are increasingly balancing responsible lending, tighter credit assessment, portfolio monitoring and cost optimisation with the need to maintain last-mile outreach. It is also a useful lens on the sector’s contribution to national financial inclusion goals: the RBI’s Financial Inclusion Index rose to 70.0 in March 2026, with the Usage sub-index driving most of the gain, and how efficiently MLI staff can serve borrowers has a direct bearing on how quickly that usage gap continues to close.
The borrower-to-staff and borrower-to-credit officer ratios provide useful indicators of how institutions deploy their workforce. A higher ratio may indicate greater workforce efficiency and economies of scale, but if it becomes excessive, it can place pressure on credit assessment, borrower interaction, collection practices and customer service. Conversely, a lower ratio may imply greater staff intensity and closer borrower engagement, although it may also raise operating costs. Striking an appropriate balance between productivity and service quality is therefore essential — and carries implications well beyond any single institution’s cost structure, since it shapes the quality and depth of financial inclusion for millions of low-income borrowers.
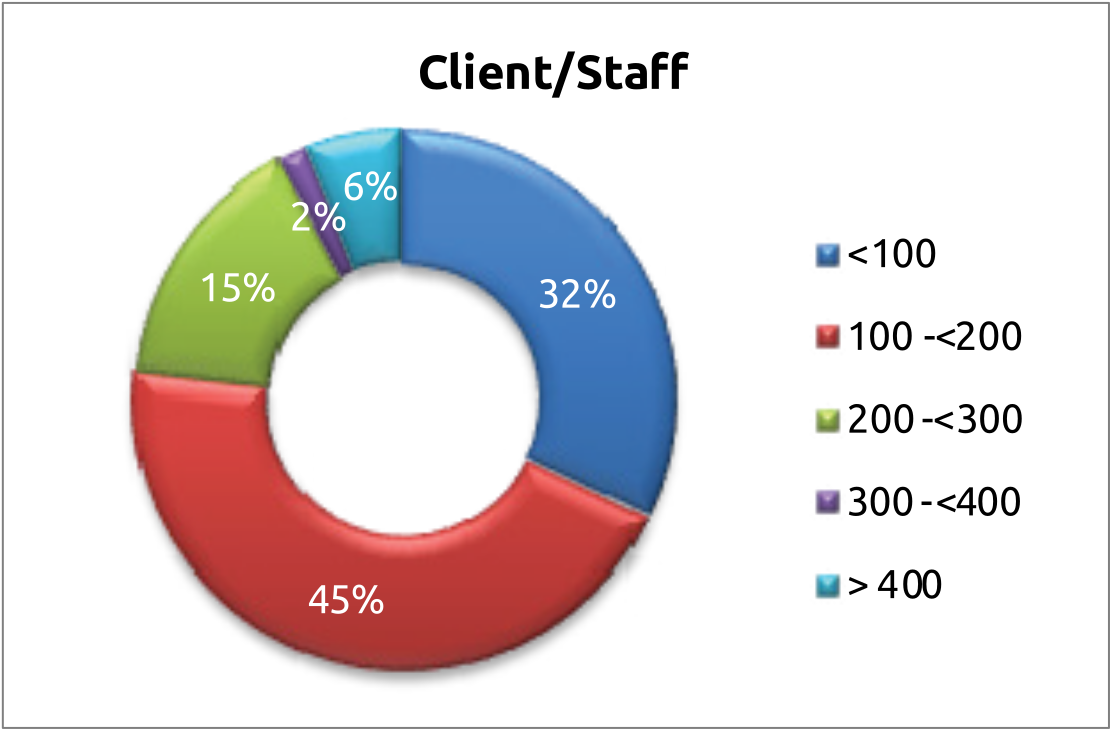
For client-to-staff ratios, 32% of institutions report fewer than 100 clients per staff member, while the largest group, 45%, falls in the 100–200 client range. A further 15% have between 200 and 300 clients per staff member. In all, 92% of institutions have fewer than 300 clients per staff member, suggesting that most institutions maintain a reasonably intensive staff structure for customer servicing, field operations, portfolio monitoring and collection efforts. Only a small proportion operate with higher workloads: 2% report 300–400 clients and 6% more than 400 clients per staff member. These higher ratios may reflect greater branch-level efficiency, larger operational scale, or increased use of digital and technology-enabled processes.
Figure 4.1.4 Distribution of MLIs based on clients served per Staff and Credit Officer
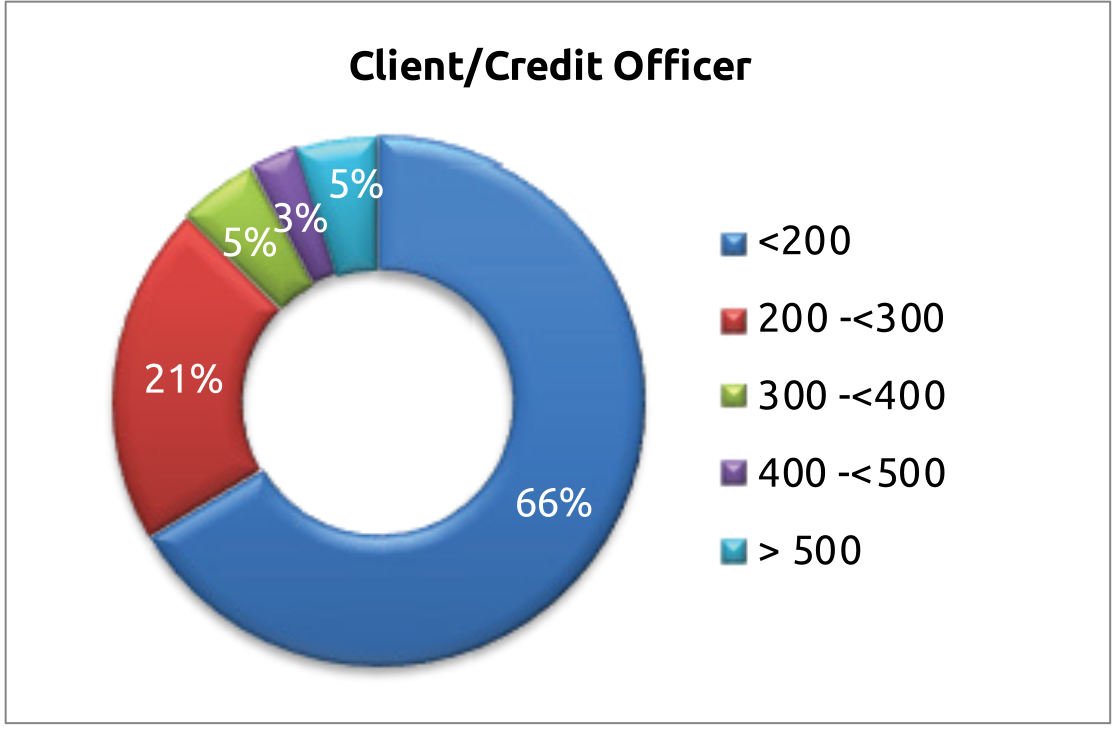
The borrower-to-credit officer ratio is comparatively higher, with 66% of institutions having fewer than 200 clients per credit officer and another 21% in the 200–300 range. As a result, 87% of institutions have fewer than 300 clients per credit officer. However, 5% report 300–400 clients, 3% between 400 and 500, and 5% more than 500 clients per credit officer. This suggests that while frontline credit functions remain relatively well staffed across most institutions, a small segment is operating with significantly higher workloads that merit closer monitoring for borrower protection.
Overall, the ratios indicate a predominantly field-intensive operating model, with institutions maintaining substantial staff engagement relative to their client base. At the same time, higher client loads at some institutions point to operational efficiencies and increasing digitalisation, particularly among larger institutions. Maintaining an appropriate balance will remain important as lenders seek to improve productivity while ensuring quality customer engagement, responsible lending, effective collections and borrower protection.
Figure 4.1.5: Trends of ABCO Across MLIs and break-up of 2026 in terms of Legal Form and Size
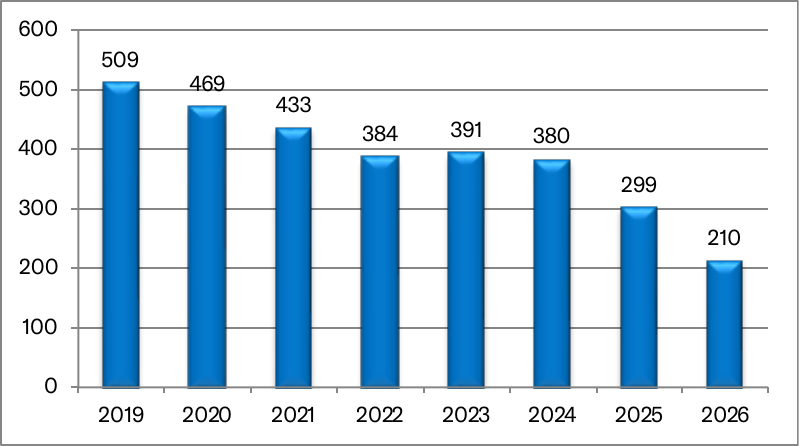
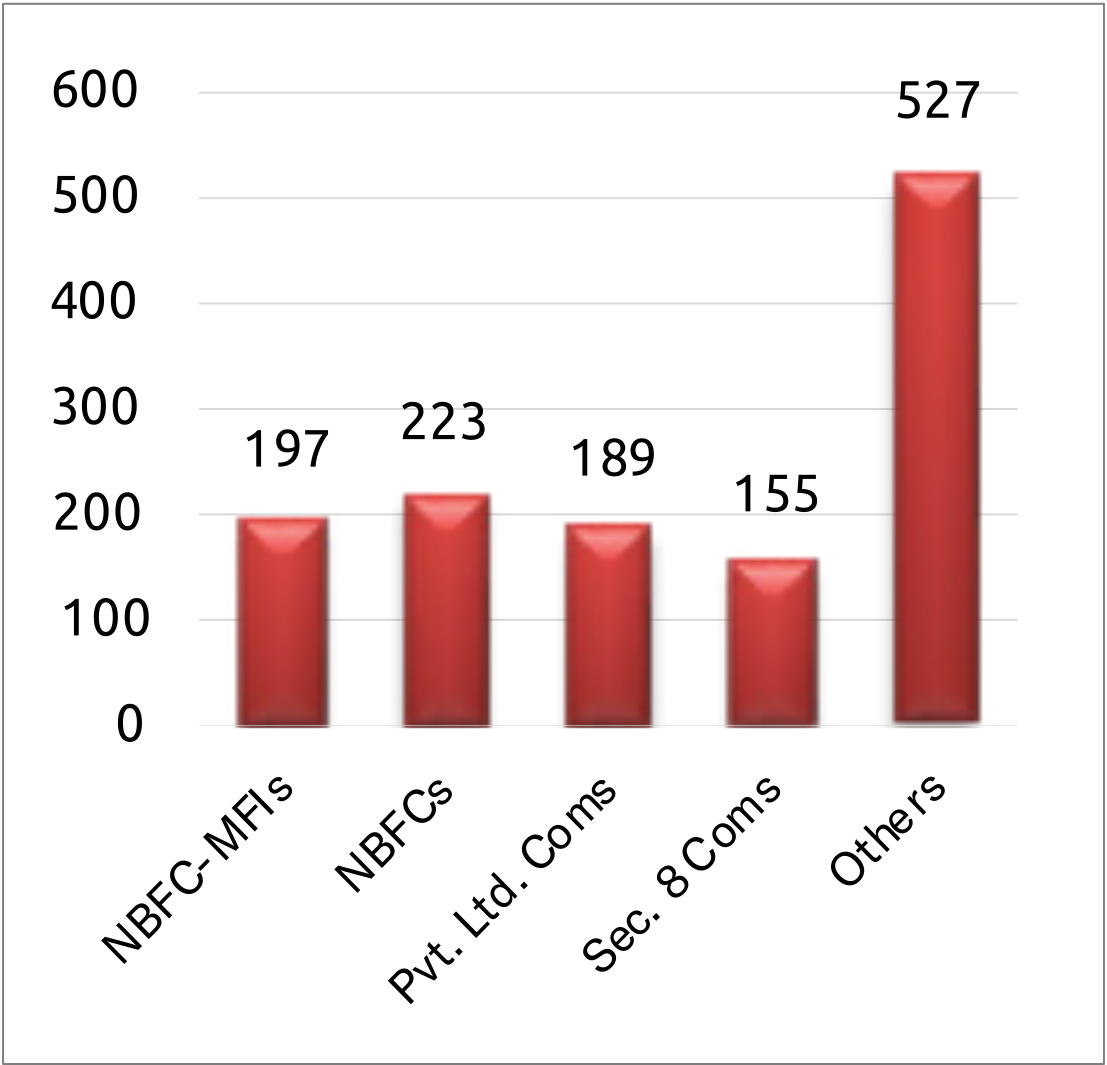
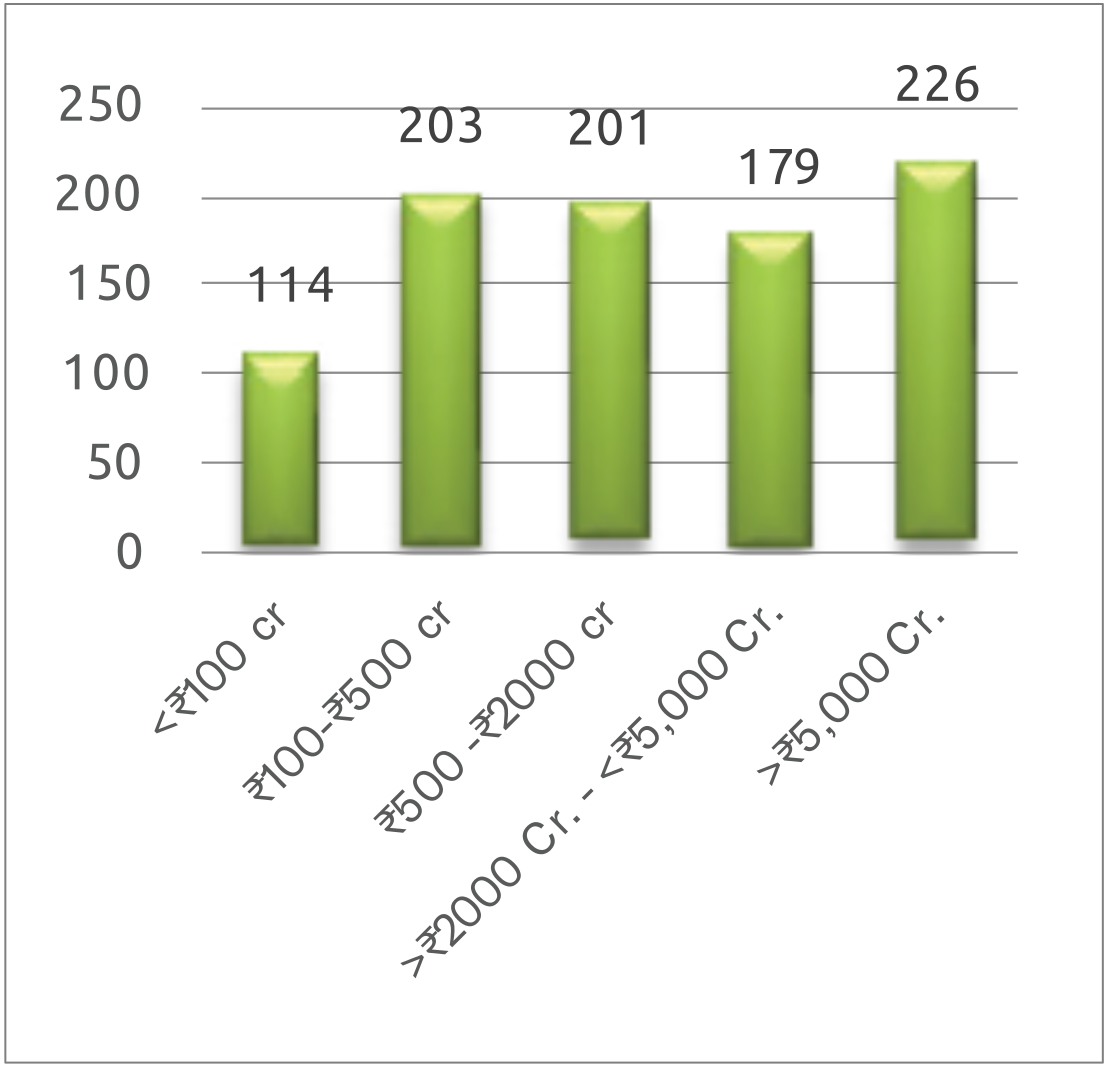
The chart shows a clear and sustained shift in staff productivity, measured by the number of clients served per credit officer, over 2019–2026. The ratio declined from 509 clients per credit officer in 2019 to 384 in 2022, before a brief uptick to 391 in 2023. It then fell further to 380 in 2024, 299 in 2025 and 210 in 2026. The steepest decline came in the last two years, with the ratio falling by nearly 21% in 2025 and 30% in 2026, leaving the 2026 level at less than half of the 2019 figure. This can be also attributed to weakening of group concept with more and more individualized lending happening in microfinance sector.
Figure 4.1.6: Trends of ABS Across MLIs and break-up of 2026 in terms of Legal Form and Size
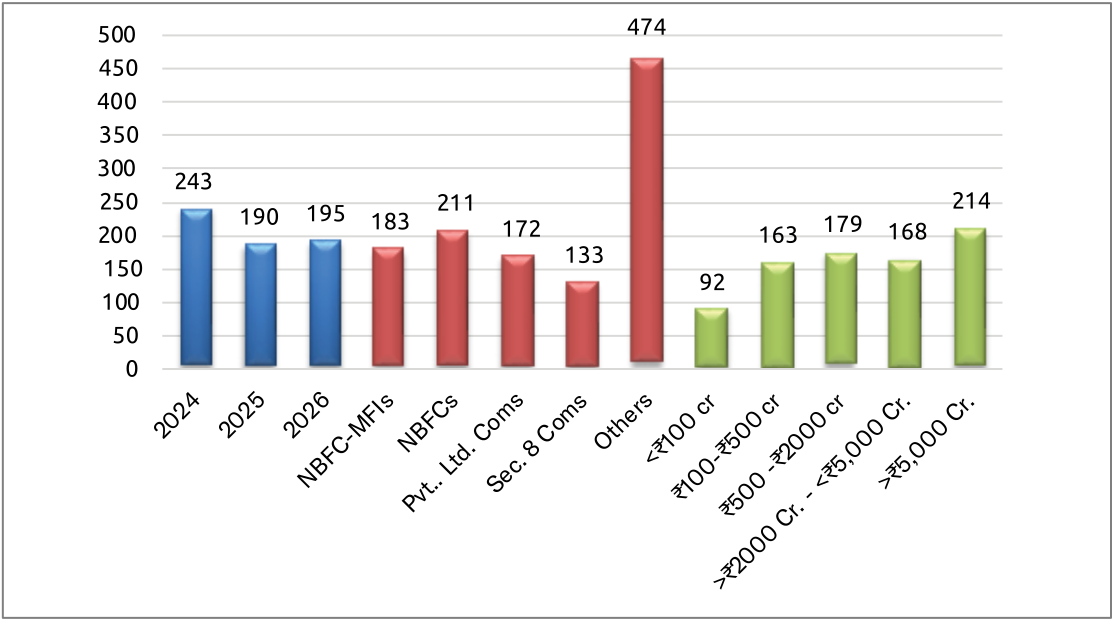
This trend suggests institutions are deploying more staff per client than at any point in the last several years — a pattern consistent with greater emphasis on responsible lending, closer borrower engagement, credit assessment, collections and portfolio monitoring.
4.1.3 Distribution of MLIs Based on Loan Portfolio per Credit Officer
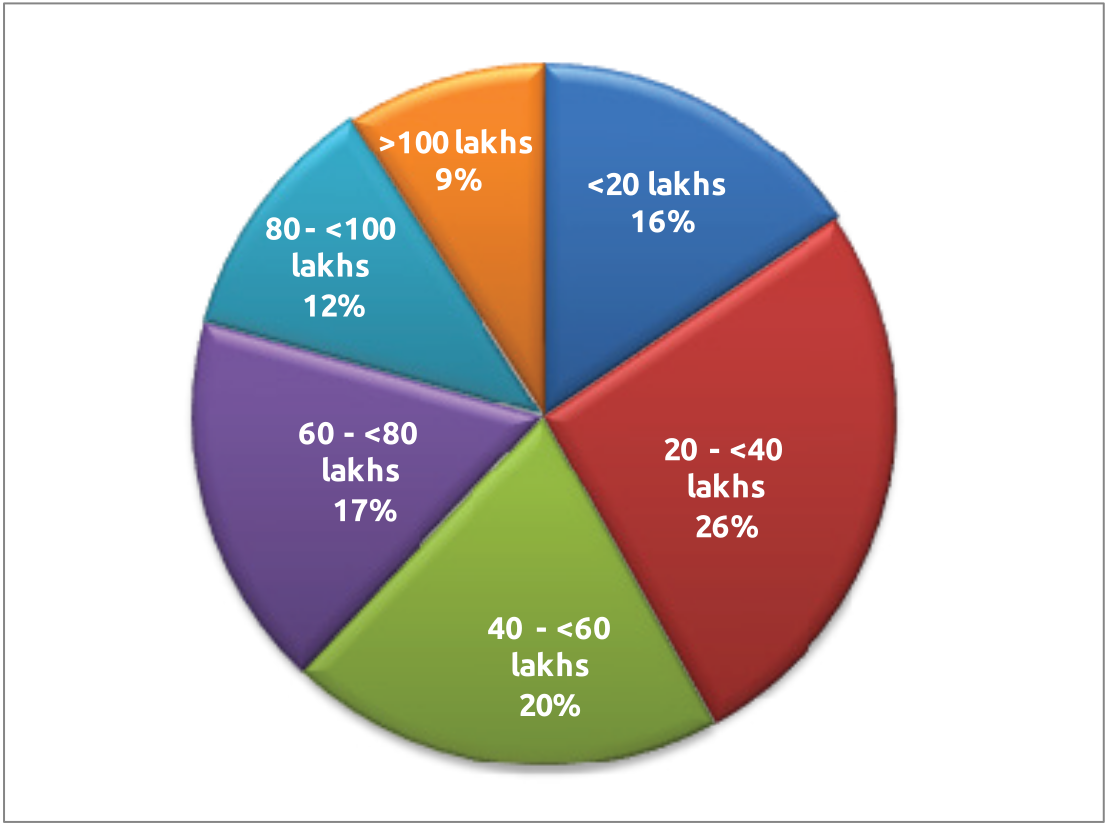
The distribution of institutions by portfolio size points to a diverse institutional landscape, with organisations spread across markedly different scales of operation. The largest proportion, 26%, falls within the ₹20–40 lakh portfolio category, followed by 20% in the ₹40–60 lakh category. A further 17% of institutions are in the ₹60–80 lakh range, while 12% have portfolios between ₹80–100 lakh. At the upper end, 9% of institutions have portfolios exceeding ₹100 lakh, indicating a sizeable group of relatively large institutions. At the lower end, 16% operate with portfolios below ₹20 lakh, highlighting the continued presence of smaller institutions in the sector.
Figure 4.1.7: Distribution of MLIs Based on Loan Portfolio per Credit Officer
Conclusion
The analysis of the microfinance sector’s institutional and workforce profile in 2026 highlights a sector undergoing significant consolidation, restructuring and operational transition. While overall staff strength moderated from the previous year’s peak, the sector maintained a substantial workforce, underscoring the continuing importance of human resources in sustaining last-mile financial inclusion even as national credit and consumption indicators stayed resilient.
At the same time, high staff exits and moderated recruitment point to workforce rationalisation as institutions respond to slower portfolio growth, tighter lending practices and the need for greater operational efficiency. This rationalisation is occurring even as the broader interest-rate and inflation environment has turned more favourable. The changing workforce composition, particularly the higher share of loan officers, points to a continued focus on frontline credit delivery, portfolio monitoring, collections and borrower engagement. The declining client-to-staff ratio further indicates a shift towards a more staff-intensive operating model, potentially supporting stronger customer engagement and more responsible lending practices.
The data also highlight the continuing scope to strengthen women’s participation in the workforce, particularly as the sector remains predominantly focused on women borrowers; at 11%, the sector’s women-staff share sits well below the 45.9% rural female labour force participation rate recorded nationally in 2025, a gap that represents both an equity concern and an underused source of talent as the sector rebuilds its frontline capacity. Overall, the sector appears to be moving from a phase of rapid expansion towards more disciplined, productivity-conscious and technology-enabled growth — a shift that, if sustained, should leave MLIs better placed to participate in India’s continuing credit and consumption upcycle without repeating the over-expansion of 2023–25. Institutions’ ability to balance workforce efficiency with service quality, employee retention, borrower protection, gender diversity and sustainable outreach will remain central to the sector’s evolution, and to its contribution to the country’s wider financial inclusion and inclusive-growth agenda.
Chapter 4 Section II
Asset Quality in MLIs
After a workforce that contracted for the first time in over a decade, even as ABS held steady, suggesting the leaner staff base didn’t come at the cost of coverage, asset quality tells a different recovery story. Portfolio At Risk beyond 30 days (PAR>30, including 180 +dpd) eased to 5.75% as on 31 March 2026 (in respect of the MLIs whose data was received) as against 7.52% at the end of FY2025-26. The improvement aligns with the trends documented in Chapter 4.I: a more field-heavy employee structure and stable borrowers-per-staff figures suggest collection discipline held up better than the workforce contraction alone might have indicated. For a sector that spent last year absorbing pressure from borrowers’ over-indebtedness, a weakening Joint Liability Group model, and high staff attrition, a nearly two-percentage-point decline in PAR>30 is meaningful. This suggests some of that stress is being eased.
That recovery, however, has not been evenly shared. The sector’s smallest institutions, those with portfolios under ₹100 crore, carried the highest PAR>30 of any size bucket at 12.22%, almost three times that of the 4.29% recorded by the largest MLIs (portfolio above ₹5,000 crore). The distribution of institutions tells the same story: even as the weighted sector average improved, the share of MLIs with PAR >30 dpd above 10% rose from 24% last year to 29% this year. In other words, the largest, best-capitalised players, who dominate the weighted average, pulled the number down, while a growing tail of smaller institutions remained. This bifurcation has a macro-financial dimension too: as the RBI has eased policy rates and system liquidity has improved1, the benefit has flowed disproportionately to larger, better-rated NBFC-MFIs with market access, while smaller institutions, more dependent on costlier bank and NBFC on-lending, have seen relatively little relief in their cost of funds, compounding the stress already visible in their portfolios. The chapter that follows looks at both halves of that picture: what allowed the sector’s core to stabilise, and why the improvement hasn’t yet reached its most vulnerable edge.
Portfolio quality remains a key indicator of the microfinance sector’s financial health, credit discipline, and sustainability. The Portfolio at Risk (PAR) above 30 days provides an important measure of emerging repayment stress by capturing the proportion of the outstanding portfolio with instalments overdue by more than 30 days. Tracking this indicator over time helps assess changes in borrower repayment behaviour, the effectiveness of collection and recovery mechanisms, and the sector’s ability to manage credit risk. It also serves as an early gauge of household-level financial stress in the wider rural economy, since microfinance borrowers are disproportionately exposed to swings in agricultural incomes, informal-sector earnings and local economic shocks that broader national indicators can mask. The trend in PAR >30 days over 2020–2026 also captures the sector’s recovery from pandemic-related disruptions and the subsequent emergence of new portfolio-quality pressures, including the industry-wide push for tighter household-indebtedness caps and fewer lenders per borrower that followed the 2024–25 stress cycle.
Figure 4.2.1: MLI Loan Portfolio at Risk (PAR)
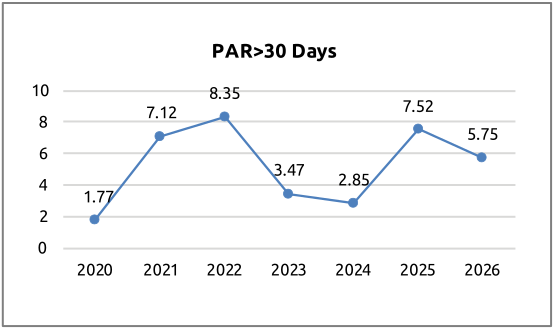
The PAR >30 days trend shows a marked deterioration during 2021–22, rising from 1.77% in 2020 to a peak of 8.35% in 2022, reflecting the lingering impact of pandemic-related disruptions on borrower repayment capacity and portfolio quality. Thereafter, portfolio quality improved substantially, with PAR >30 days declining to 3.47% in 2023 and 2.85% in 2024, indicating stronger collections and a recovery in borrower repayment behaviour, a period that coincided with strong national GDP growth of 8.2% in FY2023-24 and buoyant rural demand. A reversal occurred in 2025, when PAR >30 days rose to 7.52%, pointing to renewed portfolio stress that was driven more by sector-specific over-leveraging and JLG-model strain than by any broader economic slowdown; GDP growth remained strong at 6.5% through this period. In FY2025-26, the ratio moderated to 5.75%, an improvement of 177 basis points over 2025, although it remains well above the levels recorded in 2023–24. Overall, the trend suggests that while portfolio quality has improved from the recent deterioration, credit risk continues to be higher and requires closer attention to underwriting, borrower indebtedness, collection practices and early-warning monitoring.
The distribution of institutions by PAR levels provides a more granular view of portfolio quality and the concentration of credit risk across microfinance institutions. While aggregate PAR trends indicate the sector’s overall health, the distribution across risk bands helps identify the share of institutions experiencing low, moderate, or relatively high repayment stress. This is particularly relevant for assessing the sector’s resilience and the effectiveness of credit assessment, monitoring, and collection practices, and for anticipating which institutions have more credit exposure if rural income conditions were to soften.
1 Reserve Bank of India, Monetary Policy Committee statements, December 2025 and February 2026 (repo rate held at 5.25% in February 2026 following a 25-bps cut in December 2025). See “India Holds Rates, Revises Up FY25/26 GDP Forecasts,” Trading Economics, 6 February 2026. https://tradingeconomics.com/india/interest-rate/news/523674
Figure 4.2.2 Distribution of MLIs Based on PAR>30 dpd
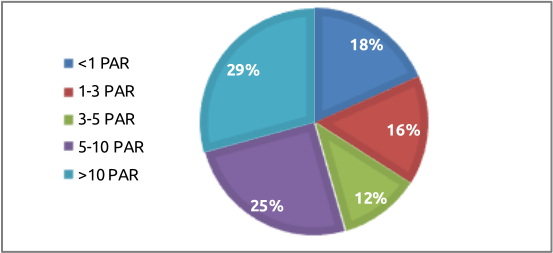
The distribution indicates a mixed portfolio-quality landscape. Around 18% of institutions have PAR> 30 dpd below 1%, suggesting very low levels of repayment stress. A further 16% fall in the 1–3% PAR range, while 12% report PAR between 3–5%. Together, 46% of institutions have PAR below 5%, indicating relatively healthy portfolio quality for nearly half of the institutions.
However, a significant proportion operates at higher levels of portfolio risk. 25% of institutions report PAR between 5–10%, while the largest single segment, 29%, has PAR above 10%. Thus, more than half of the institutions (54%) have PAR of 5% or higher, pointing to considerable variation in portfolio performance across the sector. But most of these institutions with higher PAR 30 are smaller and do not impact the overall average position.
The relatively high share of institutions with PAR above 10% warrants attention, particularly amid recent portfolio-quality pressures. Differences may stem from geographical concentration, borrower indebtedness, local economic conditions, collection challenges, and variations in underwriting and portfolio-management practices—factors that often trace back to state-level agricultural performance and rural wage trends rather than national aggregates, which can obscure meaningful regional divergence. Overall, while a sizeable segment maintains strong portfolio quality, the distribution highlights the need for continued early-warning systems, prudent credit assessment, borrower engagement and focused collection and recovery measures, alongside the sector’s self-regulatory efforts to cap household-level indebtedness and lender concentration.
Figure 4.2.3: Portfolio quality at various overdue buckets based on weighted average values
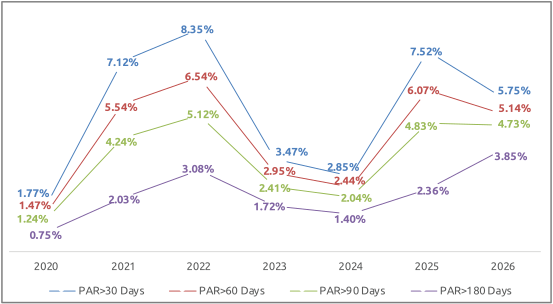
The trend in portfolio-at-risk across different delinquency buckets indicates that portfolio quality improved significantly during 2023–24 but came under renewed pressure in 2025, followed by a mixed recovery in 2026. PAR >30 days declined sharply from 8.35% in 2022 to 2.85% in 2024, with similar improvements across the >60, >90, and >180-day buckets. This improvement reflected stronger collections, a recovery in borrower cash flows, and tighter credit and portfolio-management practices, aided by a supportive economic backdrop through that period.
In FY2024-25, however, portfolio stress increased substantially, with PAR >30 days rising to 7.52%. In comparison, PAR >60 and PAR >90 days increased to 6.07% and 4.83%, respectively, a deterioration that occurred despite continued strength in the wider economy, underscoring its sector-specific origins. In FY2025-26, overall PAR >30 days improved to 5.75%, down 177 basis points from 2025. PAR >60 days also improved to 5.14%, while PAR >90 days marginally improved to 4.73%. These movements suggest some recovery in early-stage delinquency and collection performance.
However, the >180-day bucket tells a different story. PAR >180 days increased from 2.36% in 2025 to 3.85% in 2026, its highest level in the period shown. This indicates that while newer delinquencies appear to have moderated, a good portion of the stressed portfolio is ageing into deeper delinquency buckets — a pattern familiar from bank and NBFC non-performing-asset cycles more broadly, where early-stage stress typically resolves faster than legacy stress, which tends to linger even as headline ratios improve. The widening gap between PAR >30 and PAR >180 therefore warrants close monitoring, as it may indicate challenges in converting overdue accounts into successful recoveries, particularly for borrowers whose repayment capacity has not kept pace with the broader recovery in rural economic activity.
Overall, the FY2025-26 data suggest partial improvement in headline portfolio quality but continued underlying stress in the older delinquent portfolio. This highlights the importance of differentiated collection strategies, early intervention, borrower-level credit assessment and focused recovery of aged portfolios, especially for borrower segments whose incomes have not kept pace with the broader economic recovery.
Figure 4.2.4: Size-wise Portfolio quality (based on all overdue, including overdue above 179 days)2 - Weighted average value
2 It needs to be noted that the overdue amount, which is above 180 days, excludes the technical write-off amount; therefore, it may look lower than the data mentioned in Chapter 2.
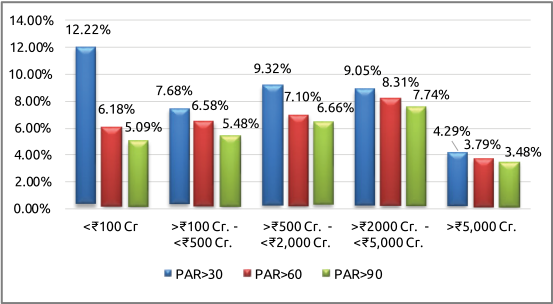
Portfolio quality by institution size shows clear variation in repayment stress across portfolio segments. Smaller institutions with portfolios below ₹100 crore record the highest PAR levels, with PAR >30, >60 and >90 days at 12.22%, 6.18% and 5.09%, respectively. Portfolio quality improves among institutions in the ₹100–500 crore category, although PAR >30 days remains elevated at 7.68%. The ₹500–2,000 crore segment records PAR >30 of 9.32%, while the ₹2,000–5,000 crore category shows similarly high stress at 9.05%, with PAR >60 and >90 days at 8.31% and 7.74%, respectively — a reminder that stress in this cycle has not been confined to the smallest players, but has cut across the mid-market as well.
In contrast, institutions with portfolios above ₹5,000 crore show substantially stronger portfolio quality, with PAR >30, >60, and >90 days at only 4.29%, 3.79%, and 3.48%, respectively. This suggests that larger institutions may benefit from greater diversification, stronger credit and risk-management systems, better access to technology and data, and greater institutional capacity for monitoring and collections. They are also better placed to benefit from the current monetary easing cycle: with the RBI having cut rates and system liquidity improving through late 2025 and early 2026, larger, higher-rated NBFC-MFIs have generally seen faster and fuller pass-through to their cost of funds than smaller entities, widening an already meaningful competitive gap. The relatively higher delinquency levels among smaller and mid-sized institutions may reflect these higher operating and funding costs, concentrated geographic exposure, limited risk-management capacity and greater vulnerability to localised economic or repayment shocks. Overall, the data underline the importance of strengthening credit assessment, early-warning mechanisms and recovery capabilities, particularly among smaller institutions, as well as the case for differentiated funding support so that scale alone does not become the main determinant of survival.
Conclusion
The analysis of portfolio quality highlights a mixed but gradually stabilising credit environment for the microfinance sector in FY2025-26, set against a national economy that continued to expand at a healthy pace — India’s real GDP grew by an estimated 7.4% in FY2025-26. After the significant improvement witnessed during 2023–24, portfolio stress increased sharply in FY2024-25, while FY2025-26 has seen a moderation in early-stage delinquency, with PAR >30 and PAR >60 days improving from the previous year. However, the continued increase in the PAR >180-day bucket indicates that a portion of stressed accounts is ageing and remains a concern for recoveries and portfolio health, even as the broader economy and a reasonable kharif harvest provided a supportive, if not especially generous, backdrop for borrower incomes.
Portfolio quality also varies considerably by institutional size. Larger institutions, particularly those with portfolios above ₹5,000 crore, report substantially lower delinquency levels, while smaller institutions show comparatively higher PAR across the major delinquency buckets. This suggests that scale, portfolio diversification, stronger risk-management systems, technology adoption and greater collection capacity can contribute to better portfolio resilience — advantages reinforced by easier access to the benefits of the RBI’s softer rate cycle. At the same time, smaller institutions may remain more vulnerable to geographic concentration, localised shocks, higher funding costs and resource constraints, underscoring why scale alone should not be allowed to become the deciding factor in which institutions survive this consolidation.
Overall, the 2026 trends suggest that the sector is moving towards greater credit discipline and more measured growth, but portfolio stress remains uneven, and the improvement so far owes as much to a benign macro environment, solid GDP growth, a reasonable harvest, and a softening interest-rate cycle, as it does to structural fixes within the sector itself. Sustained attention to household-level credit assessment, borrower indebtedness, early-warning systems, responsible collections and resolution of aged overdue accounts will be important to ensure that the recent improvement translates into durable portfolio quality and sustainable growth, particularly if farm-gate incomes remain soft or the favourable funding environment does not extend evenly to smaller and mid-sized institutions.
Chapter 4 Section III
Income and Expenditure Analysis
The income and expenditure analysis of the microfinance sector for FY 2026 indicates a decline compared to previous years, against the backdrop of a recalibration driven by prolonged stress in the sector. As reported in Chapter 2, the microfinance industry recorded an 11% year-on-year fall in total loan outstanding, mostly due to banks and SFBs taking a very cautious approach and running down the portfolio. NBFC-MFIs, which account for the bulk of Sa-Dhan’s membership, were nearly flat, with a slight degrowth of -1%.
Asset quality improved significantly over the same period: sector-wide PAR 30-179 DPD fell from 6.63% to 2.34%, and MLI-level PAR>30 eased from 7.52% to 5.75%, though the improvement was concentrated more at the larger end of the sector than the smaller. Against this improving but uneven picture, operating costs rose sharply to 8.47% in FY2025-26 from 7.09% the year before, even as total income held essentially flat at ₹36,191 crore. This is notable because it did not happen against an inflationary backdrop (the RBI projected FY2025-26 retail inflation at just 2.1%1, comfortably within its tolerance band for most of the year), which means the sector’s rising cost ratio is being driven by its own operating choices rather than by broader price pressure in the economy. A workforce that contracted 13% did not translate into a lighter wage bill either: personnel expenses climbed from 21.6% to 26.5% of total costs, suggesting the sector is paying more per employee even as it employs fewer.
Three threads run through this year’s cost structure. First, the sector lent differently: loan accounts fell 21% even as average ticket size rose 17% to ₹59,473, pointing to fewer but larger and more carefully underwritten loans, a shift that typically raises per-loan servicing and compliance costs even as it improves portfolio quality. It is also a meaningfully larger loan relative to the rural income borrowers draw on, at a time when farm-gate price growth has been unusually soft, which makes careful underwriting at this ticket size more important than ever. Second, the cost of stabilisation itself shows up directly: intensified collections on a still-recovering book, retention spending in a year of continued high attrition, and ongoing investment in digital and AI-enabled tools all tend to raise costs before their benefits are fully realised. Third, financial expenses tell a more encouraging story than operating costs: the finance cost ratio eased to 10.9% from 11.5% on a consistent weighted-average basis, a moderation that lines up with the RBI’s own easing cycle through late 2025 and early 2026, suggesting the sector’s cost of borrowed funds genuinely improved even as operating and personnel costs rose. The one figure worth reading with some caution is the size-wise breakdown of operating cost, where last year’s “>₹2,000 crore” bucket was split into two narrower categories this year, making a direct year-on-year comparison at that level less than exact. Taken together, the numbers describe a sector absorbing the near-term operating cost of a broader correction, pulling back from higher-risk lending, tightening underwriting, and holding onto scarcer staff, even as its cost of funds moved in the right direction on the back of a friendlier monetary policy backdrop.
1 https://www.mospi.gov.in/uploads/latestReleases/latest_release_1767781372753_1380ce82-f5a5-440d-99e6-e6b35af0deb5_GDP_Press_Note_on_FAE_2025-26.pdf ; https://ddnews.gov.in/en/rbi-projects-inflation-at-2-1-in-fy26-revises-fy27-growth-outlook-upward/
4.3.1 Expenditure Analysis
Operating costs are a key determinant of the efficiency, competitiveness and financial sustainability of microfinance institutions. Given the sector’s field-intensive operating model, institutions incur high costs in mobilising funds, maintaining a workforce, managing branches and delivering services to borrowers, particularly across rural and underserved markets. The composition of operating expenses therefore provides useful insight into the major cost drivers and the efficiency of institutional operations. In an environment characterised by slower portfolio growth, greater emphasis on responsible lending, and increasing adoption of digital technologies, effective cost management has become more important. At the same time, cost optimisation must be balanced with adequate investment in human resources, technology, risk management, customer service, and borrower protection — all of which ultimately determine how affordably and sustainably the sector can keep extending credit to borrowers who remain outside the reach of mainstream banking. The following analysis examines the distribution of major expense categories and highlights the relative contribution of financial, personnel, administrative, and other expenses to the sector’s overall cost structure.
Figure 4.3.1: Breakdown of expenses under various categories by MLIs2
2 Personnel Expenses include salary & wages, including incentive expenses; Other Admin Expenses include expenses incurred on travel, admin, training, and depreciation; Other Expenses include Loan Loss Provision expenses and any other expenses.
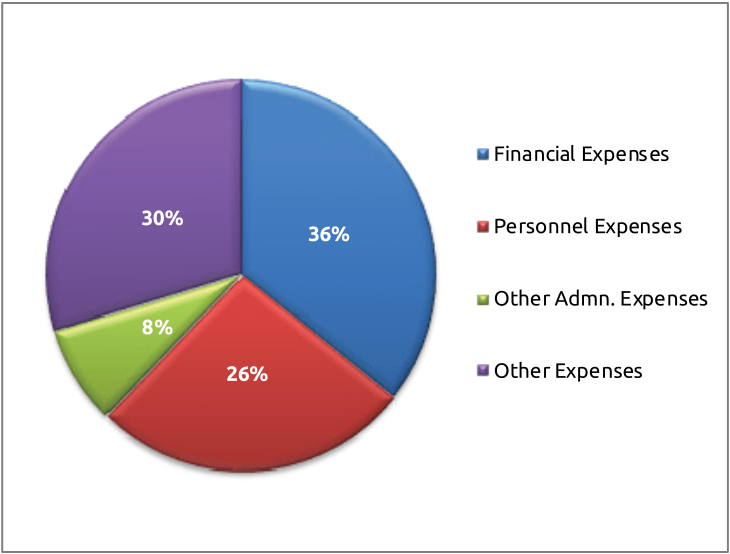
The cost structure of microfinance institutions indicates a significant allocation towards financial and operational expenses, reflecting the cost-intensive nature of delivering financial services to underserved and geographically dispersed borrowers. Financial expenses account for the largest share at 36%, followed by other expenses at 30% and personnel expenses at 26%. The remaining 8% is attributable to other admin expenses. Together, financial and other expenses constitute 68%. Here it may be noted that a significant share of the other expenses includes Loan Loss Provision Expenses. Personnel expenses, at over one-fourth of total costs, also underline the continued importance of a field-oriented workforce for customer engagement, credit assessment and portfolio management. The relatively small share of other expenses suggests that the major cost drivers remain the cost of funds, employee-related expenditure and core administrative operations. In the current environment of slower portfolio growth and greater emphasis on efficiency, managing these costs while maintaining service quality and responsible lending practices will be important for the sector’s long-term sustainability.
The higher share of administrative cost is not a very encouraging aspect. The MLIs need to work on this through efficiency in operation, by adopting technology etc and there should be an effort to bring it down so that the ultimate cost will be reduced and the borrowers can be benefitted to that extent.
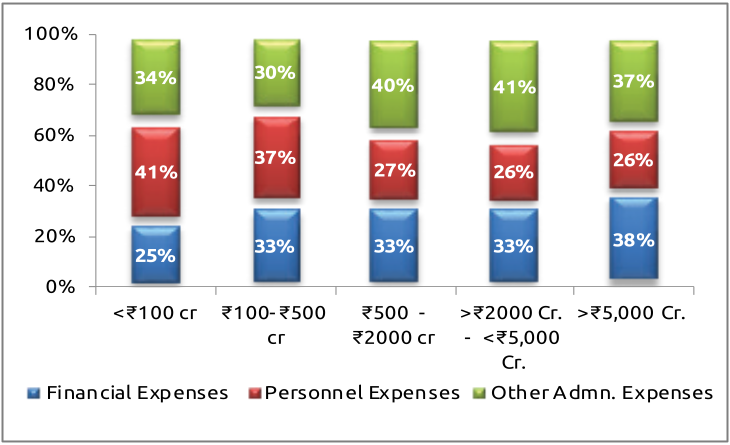
Figure 4.3.2: Break up of expenses by MLIs based on legal form and portfolio size
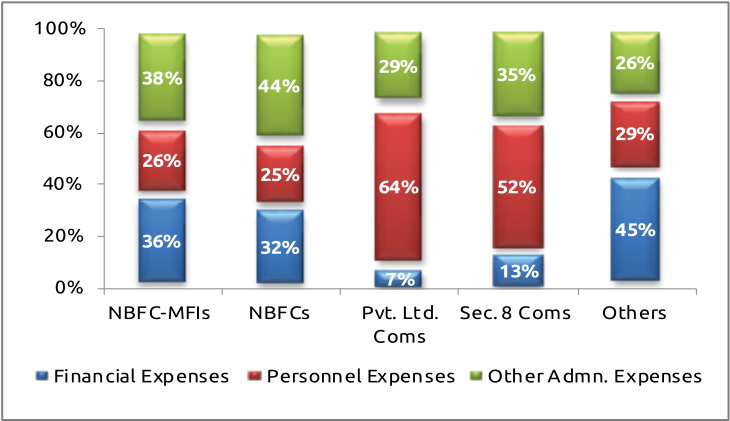
The cost structure varies considerably across legal forms and institutional size, reflecting differences in business models, scale and operating intensity. Among legal forms, NBFC-MFIs have a relatively balanced cost structure, with financial expenses accounting for 36%, personnel expenses 26% and other administrative expenses 38%. NBFCs show a similar pattern, although administrative expenses are higher at 44%. In contrast, Private Limited Companies have a markedly higher share of personnel expenses at 64%, while financial expenses account for only 7% because their financial cost is only for funds needed to meet working capital. Sec. 8 companies also have a relatively high personnel cost share of 52%.
Across institution sizes, the cost structure appears more consistent. Smaller institutions with portfolios below ₹100 crore have the highest personnel expense share at 41%, compared with 25% for financial expenses and 34% for administration. As institutional size increases, the personnel cost component declines, reaching 26% among institutions in the ₹2,000–5,000 crore range, while administrative expenses rise to 41%. Financial expenses remain relatively unchanged at around 33% among institutions above ₹100 crore. Overall, the data suggest that larger institutions benefit from greater scale in personnel deployment, while smaller institutions face relatively higher staff-related costs. The increasing administrative cost share among larger institutions may reflect greater investment in technology, compliance, risk management and institutional infrastructure required to manage larger portfolios.
4.3.1.i Operating Cost3
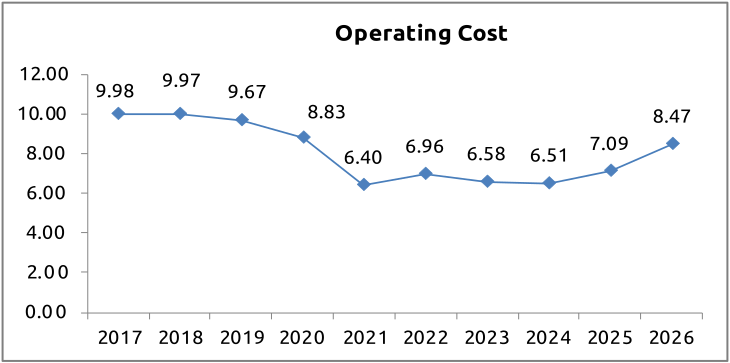
The operating expense ratio is an important measure of the sector’s cost efficiency, indicating operating expenses relative to the scale of business operations. Tracking this ratio over time helps assess changes in institutional efficiency, cost pressures, and microfinance institutions’ ability to manage expenses amid evolving portfolio and operational conditions. The operating cost ratio remained relatively high during 2017–20, declining from 9.98% in 2017 to 8.83% in 2019 before falling sharply to 6.40% in 2021. It remained broadly stable at around 6.5–7.0% during 2022–24, indicating improved cost efficiency. However, the ratio increased to 7.09% in 2025 and further to 8.47% in 2026, signalling renewed operating cost pressures. The 2026 increase may reflect higher staff intensity, investments in compliance and risk management, portfolio-quality management, and slower portfolio growth, which can raise the cost ratio as operating expenses are spread over a slower-growing business base. This rise occurred in a year of unusually benign national consumer-price inflation, reinforcing that it is a sector-specific, structural cost increase rather than one imported from the wider economy. While the ratio remains below the levels observed in 2017–20, the recent upward movement highlights the importance of cost optimisation and productivity improvements for maintaining operational and financial sustainability.
3 Define as (Personnel Cost including incentive + Travel Cost + Admin Cost + Group Dev. Cost/Training Cost + Depreciation + Any Others)/Average Portfolio Outstanding.
Figure 4.3.3: Trends of Operating Cost across MLI Categories4
4 Based on weighted average for all MLIs.
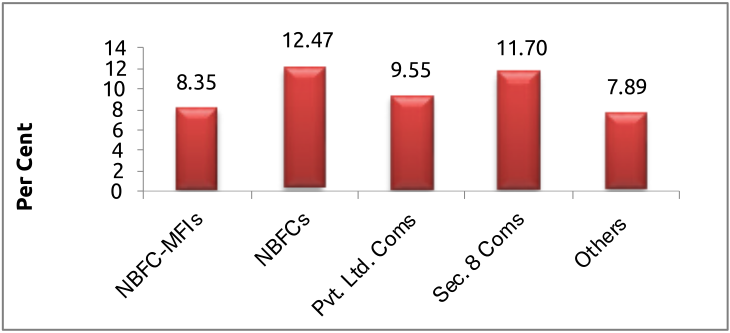
The cost ratio varies considerably across both legal forms and institutional size. By legal form, NBFCs record the highest ratio at 12.47%, followed by Section 8 companies at 11.70% and Private Limited Companies at 9.55%. NBFC-MFIs record a ratio of 8.35%, while Other institutions have the lowest ratio at 7.89%. The relatively higher ratios among NBFCs and Section 8 companies indicate greater operating cost intensity, while the lower ratios among NBFC-MFIs and other institutions suggest comparatively lower operating costs relative to their operating income.
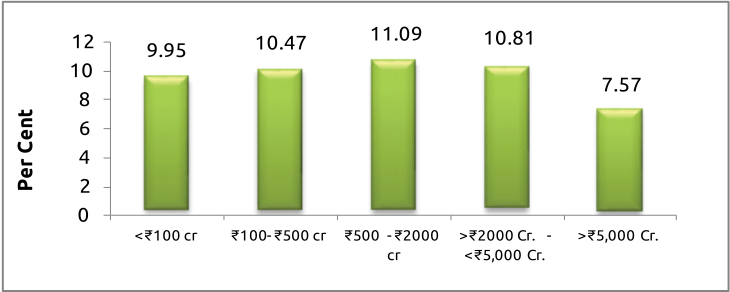
Across portfolio size, the cost ratio generally increases with institutional size up to the ₹500–2,000 crore category, before declining among larger institutions. Institutions with a portfolio below ₹100 crore record a ratio of 9.95%, which rises to 10.47% for those in the ₹100–500 crore range and peaks at 11.09% among institutions with ₹500–2,000 crore portfolios. The ratio then moderates to 10.81% for institutions in the ₹2,000–5,000 crore category and declines substantially to 7.57% among the largest institutions with portfolios above ₹5,000 crore. The substantially lower ratio among the largest institutions points to the benefits of scale, with operating and administrative costs being spread across a larger portfolio. Overall, the distribution highlights the role of scale and cost optimisation in improving operating efficiency, particularly as institutions expand their portfolio.
4.3.1.ii Finance Cost5
Finance cost is a key component of microfinance institutions’ overall cost structure and directly affects their financial sustainability, pricing, and profitability. Given the sector’s dependence on external borrowings and institutional funding, movements in the cost of funds can significantly affect operating margins and lenders’ ability to maintain affordable, sustainable credit. Tracking the finance cost ratio over time indicates changes in funding conditions, borrowing patterns, interest rates, and liability management, and offers a direct read on how faithfully the RBI’s monetary policy cycle is transmitted to the last-mile borrower. The trend also helps assess how institutions have responded to changing market conditions while balancing the need for adequate funding with cost efficiency.
5 Define as the Total expense incurred for acquiring funds /Average Outstanding Borrowings.
Figure 4.3.4: Trends of Finance Cost across MLI Categories6
6 Based on weighted average of all MLIs.
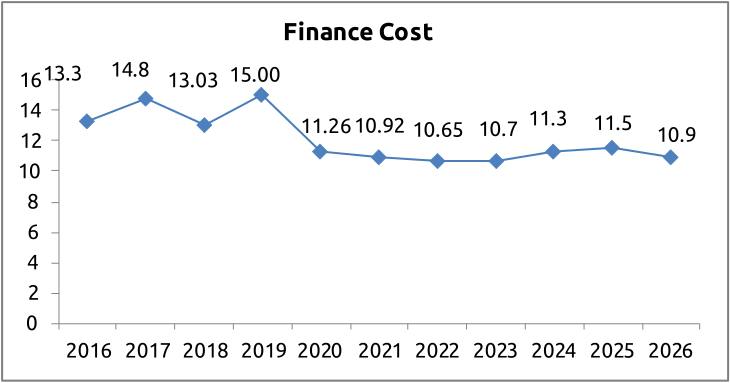
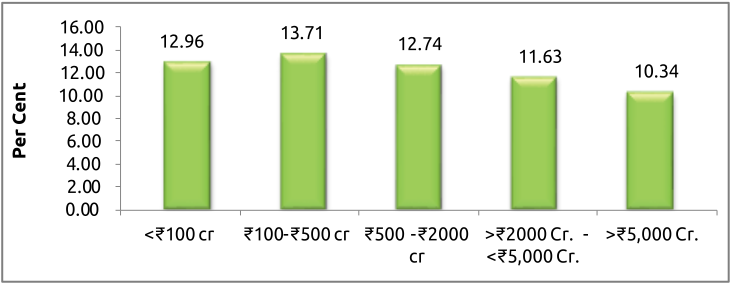
The finance cost shows a clear relationship with institutional scale, with larger institutions generally recording markedly lower funding costs. By portfolio size, finance cost is highest for institutions in the ₹100–500 crore category at 13.71%, followed by those below ₹100 crore at 12.96% and the ₹500–2,000 crore segment at 12.74%. It declines to 11.63% among institutions in the ₹2,000–5,000 crore range and falls to 10.34% for institutions above ₹5,000 crore. This pattern suggests that larger institutions may benefit from better access to diversified, relatively lower-cost funding, stronger credit profiles, and economies of scale in fund mobilisation.
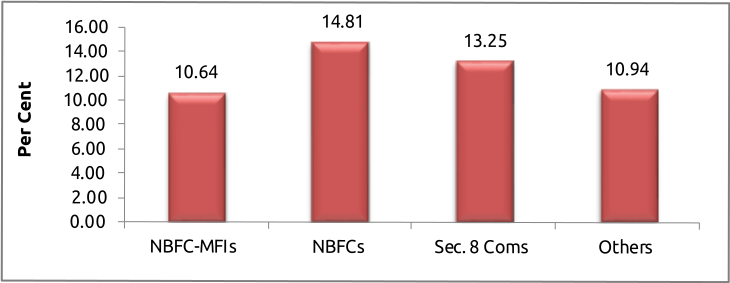
Across legal forms, NBFCs record the highest finance cost at 14.81%, followed by Sec. 8 companies at 13.25% and Other institutions at 10.94%. NBFC-MFIs report a comparatively lower finance cost of 10.64%, despite being the dominant institutional category. The variation may reflect differences in funding sources, access to bank and institutional finance, borrowing terms, creditworthiness and liability structures. In case of NBFC MFIs, the maximum borrowing is done by larger NBFC-MFIs, who generally able to access funds more economically. This could also be reason for an lower average cost of funds for NBFC-MFIs. The share of smaller MFIs which access funds generally at a higher cost, has been less during the year.
Overall, the data reinforce the importance of funding diversification and scale in managing finance costs, particularly for smaller institutions and entities with relatively limited access to low-cost institutional funding.
4.3.1.iii Trends of Operating Cost and Finance Cost
The combined movement of finance cost and operating cost provides a useful perspective on the microfinance sector’s evolving cost structure and sustainability. Finance cost declined substantially from the higher levels observed during 2016–19, when it ranged between 13.0% and 15.0%, to around 10.6–10.9% during 2021–23. Finance cost then increased to 11.5% in 2025 before moderating marginally to 10.9% in 2026 — a moderation that tracks closely with the RBI’s own rate actions, which cut the repo rate by 25 basis points in December 2025 and held it at 5.25% in February 2026 on the back of a softer inflation outlook7. That the sector’s own cost of funds eased only marginally despite this policy support suggests transmission remains incomplete, and that funding pressures continue to matter more for some institutions than the headline number implies.
Operating cost followed a different trajectory. It declined sharply from around 10% in 2017–18 to 6.4% in 2021, remaining broadly contained through 2024. However, it increased to 7.09% in 2025 and further to 8.47% in 2026 — even as the broader economy grew by an estimated 7.4% and inflation stayed low, underlining that this is a cost story written inside the sector rather than one imposed from outside it. This recent rise is particularly significant when viewed alongside the workforce trends discussed earlier. Staff strength declined in 2026, but the client-to-staff ratio also fell sharply to 210, suggesting that institutions are deploying greater staff intensity per client. Higher expenditure on collection of dues, compliance, risk management, borrower engagement and portfolio monitoring may also be contributing to the increase in operating costs.
Taken together, finance and operating costs amounted to approximately 19.4% in 2026, compared with around 18.6% in 2025 and 17.8% in 2024. Thus, despite lower finance costs, rising operating costs have pushed the overall cost burden upward — and they have done so even as the RBI’s own easing cycle was working in the sector’s favour on the funding side, which means the net increase in the all-in cost ratio is, if anything, an understatement of how much operating costs alone have risen. This has important implications for the sector: with portfolio growth moderating and credit-quality pressures persisting, institutions may have less scope to absorb rising costs without affecting margins. At the same time, the higher operating intensity may support better underwriting, collections and borrower protection.
The key challenge for the sector is therefore not simply cost reduction, but achieving productivity-led efficiency, leveraging technology and scale to contain costs while preserving adequate investment in frontline staff, risk management and responsible lending. This is also the space in which the RBI’s principles-based pricing framework for microfinance loans8 operates: institutions set interest rates through a board-approved policy rather than a prescribed cap, which means cost discipline, and not regulation alone, is what will ultimately determine how much of the current cost pressure gets passed on to borrowers. The substantially lower cost ratios among the largest institutions further indicate the potential benefits of scale and funding diversification, while smaller and mid-sized institutions may face greater pressure to improve operational efficiency and access more competitive funding.
7 Reserve Bank of India, Monetary Policy Committee statements, December 2025 and February 2026 (repo rate held at 5.25% in February 2026 following a 25-bps cut in December 2025). See “India Holds Rates, Revises Up FY25/26 GDP Forecasts,” Trading Economics, 6 February 2026. https://tradingeconomics.com/india/interest-rate/news/523674
8 Reserve Bank of India, Master Direction – Reserve Bank of India (Regulatory Framework for Microfinance Loans) Directions, 2022 (effective 1 April 2022, as updated), which requires regulated entities to price microfinance loans under a board-approved policy rather than a prescribed interest-rate cap. https://rbidocs.rbi.org.in/rdocs/notification/PDFs/89MDCD45D92E34D84C2695DF6977E4298BFF.PDF
4.3.2 Income Analysis
The income structure of microfinance institutions provides an important indication of the strength and sustainability of their core business model, as well as the extent to which institutions are developing complementary revenue sources. While interest income from lending remains central to the sector, institutions are increasingly engaging in activities such as portfolio securitisation, fee-based services, business correspondent arrangements and third-party product distribution. Examining the composition of income helps assess the sector’s dependence on lending income, the degree of revenue diversification, and its potential resilience to changes in portfolio growth, interest rates, and funding costs — resilience that matters more in a year when the RBI’s own monetary cycle has been moving, since a portfolio dominated by interest income is, by construction, more exposed to swings in the wider rate environment than one with a meaningful share of fee-based or non-lending revenue.
The income structure of microfinance institutions remains strongly concentrated in interest income from the loan portfolio, which accounts for 80% of total income. This highlights the sector’s continued dependence on core lending as its primary revenue source. Portfolio sale and securitisation contribute 5%, while investment income accounts for 2%. Other revenue streams, including processing fees (3%), other fees and charges (2%), BC agreements (3%), third-party product sales (0.3%) and other sources (5%), together account for a relatively modest share.
Figure 4.3.5: Break-up of Income
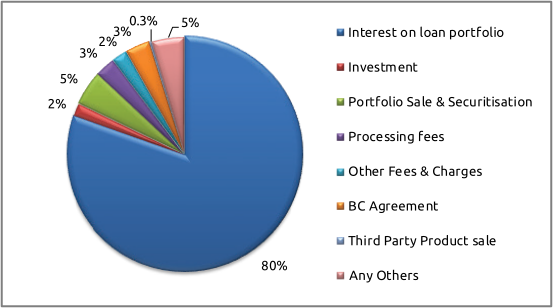
The composition indicates that while institutions are developing supplementary revenue streams, lending remains the dominant business model. Diversification through securitisation, fee-based services, BC arrangements, and third-party products can provide additional income and support liquidity and capital management. However, heavy reliance on interest income also means portfolio growth, repayment performance, pricing, and cost of funds remain critical determinants of institutional financial performance. In the current environment of moderated portfolio growth and heightened focus on responsible lending, developing sustainable non-interest revenue streams could become increasingly relevant for improving income resilience without relying solely on loan portfolio expansion.
4.3.2.i Yield on Loan Portfolio
Portfolio yield is an important indicator of the revenue-generating capacity of the microfinance portfolio and provides insight into the relationship between lending operations, pricing and institutional sustainability. It reflects the income generated from the loan portfolio and is influenced by factors such as interest rates, portfolio composition, borrower repayment patterns and changes in lending practices. Tracking portfolio yield over time helps assess how the sector has responded to changing market conditions, regulatory developments and the growing emphasis on responsible lending.
Figure 4.3.6: Yield Trend of MLIs
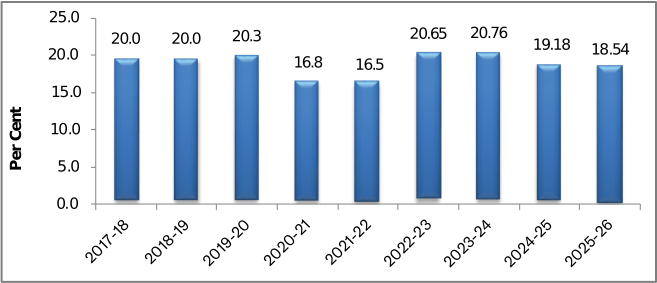
The trend indicates that the yield/return from the microfinance portfolio remained relatively stable at around 20% during 2017–20, before declining sharply during the pandemic period to 16.8% in 2020–21 and 16.5% in 2021–22. It recovered strongly thereafter, reaching 20.65% in 2022–23 and 20.76% in 2023–24. Since then, the ratio has moderated to 19.18% in 2024–25 and 18.54% in 2025–26. The recent decline of 64 basis points in 2025–26 suggests some moderation in portfolio yield, potentially reflecting changes in portfolio mix, pricing, competitive conditions and the increasing emphasis on responsible lending under the RBI’s principles-based pricing framework for microfinance loans, which requires institutions to set rates through a board-approved policy rather than a prescribed cap. Alongside rising operating costs and relatively stable finance costs, the lower yield could put pressure on institutional margins. However, the current level remains above the pandemic-period lows, indicating that the sector continues to generate a relatively stable return from its core lending portfolio.
Figure 4.3.7: Yield on Portfolio across MLIs
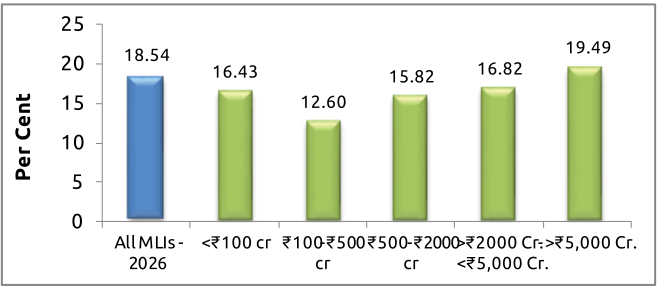
The 2026 portfolio yield shows a clear relationship with institutional scale, with larger institutions generally reporting higher yields. The overall yield stands at 18.54%, while institutions below ₹100 crore record 16.43% and those in the ₹100–500 crore category recorded the lowest yield of 12.60%. Yields then rise to 15.82% for ₹500–2,000 crore, 16.82% for ₹2,000–5,000 crore, and reach 19.49% for institutions above ₹5,000 crore. This variation may reflect differences in portfolio composition, pricing, product mix, and larger institutions’ ability to optimise portfolio deployment.
4.3.3 Margin
The comparison of portfolio yield and finance cost highlights a clear relationship between institutional scale and operating margins in 2026. The overall pattern suggests that larger institutions are better positioned to generate a positive spread between portfolio income and the cost of funds. Institutions with portfolios below ₹100 crore report a yield of 16.43% against a finance cost of 12.96%, resulting in a margin of 3.47 percentage points. The ₹100–500 crore segment records a negative margin of -1.11 percentage points, as its finance cost of 13.71% exceeds its portfolio yield of 12.60%. This indicates considerable pressure on financial sustainability for institutions in this segment even before operating and other administrative expenses are considered.
The margin improves to 3.08 percentage points for institutions in the ₹500–2,000 crore category and rises further to 5.19 percentage points among institutions in the ₹2,000–5,000 crore range. The strongest position is observed among institutions with portfolios above ₹5,000 crore, where a 19.49% yield and 10.34% finance cost generate a margin of 9.15 percentage points.
Figure 4.3.8: Yield, Cost and Margin of MLIs – size-wise based on weighted average values
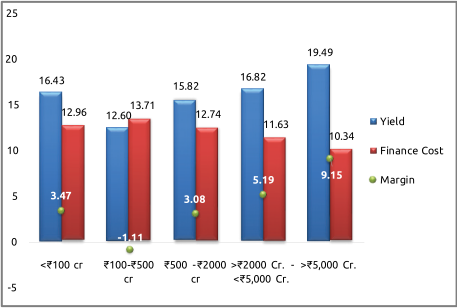
The data suggest that scale provides a significant advantage in managing funding costs and generating financial spread. Larger institutions may benefit from better access to diversified funding sources, stronger institutional credit profiles and greater bargaining power with lenders. Conversely, smaller and mid-sized institutions face greater vulnerability where relatively high funding costs coincide with lower portfolio yields.
Importantly, the margin shown here is not the final profit margin, as institutions must still meet operating, personnel, administrative and credit-loss expenses. Therefore, negative or narrow spreads in some segments indicate that these institutions have limited headroom to absorb operating costs, while larger institutions have greater capacity to absorb them and remain sustainable. This reinforces the importance of funding diversification, scale efficiencies, portfolio optimisation and operational productivity, particularly for smaller and mid-sized MFIs.
Conclusion
The analysis indicates that the microfinance sector is operating in an environment of moderating portfolio yields, rising operating costs and relatively stable finance costs. It is seen that the sector’s cost pressure is a structural, internally driven story — staff intensity, compliance, collections — rather than one the wider economy imposed on it, and it means the easing the sector did get, largely on the finance-cost side via the RBI’s own rate cuts, was only partly able to offset the rise in operating costs. While larger institutions benefit from economies of scale, lower funding costs and stronger financial spreads, smaller and mid-sized institutions face greater cost and margin pressures. The rise in operating costs, along with higher staff intensity, reflects greater emphasis on risk management, responsible lending, and borrower engagement. Going forward, cost efficiency, diversified funding, technology adoption and productivity improvements will be important for maintaining sustainable growth while preserving portfolio quality and borrower protection — particularly if the favourable funding environment does not extend evenly across the sector, or if the recent softness in inflation gives way to the upside pressures the RBI itself has flagged from energy prices and currency movements.
As microfinance loan pricing depends on funding and operating costs, MLIs need to rationalise and reduce costs, especially where they have control. In this context, operational and risk costs are important and need close monitoring. Ultimately, microfinance should benefit borrowers through better pricing, which remains a point of criticism.
Chapter 4: Section IV
Self-Sustainability and Profitability
Although the sector went through a recalibration phase, it has recorded a positive Return on Assets (RoA) with a weighted average of 0.21%, as against (-1.71%) in FY2024-25, and the Return on Equity (RoE) improved to 2.51% from a near-flat 0.32% in the previous year. This clearly indicates that the worst is over and the microfinance sector is on the comeback.
Other parameters, such as Operational Self-Sufficiency (OSS), held steady at 104% industry-wide, unchanged from last year; the Private Limited Companies segment recovered from 95% to 101.5% this year. The improvement aligns with the asset-quality gains detailed in Section 4.2 and, at least in part, with the finance-cost reduction documented in Section 4.3, with the RBI easing policy rates through late 2025 and early 2026. The overall economy looked better during the year, reflecting the improvement in the microfinance sector also, as the Indian economy grew at an estimated 7.4% in FY2025-261.
That recovery, however, was neither uniform nor complete. NBFC-MFIs, which carry the bulk of the sector’s portfolio, led the improvement with a positive RoA of 0.34% and RoE of 2.69%. The clearest divide was by size. Only Very Large MLIs (Portfolio>₹5,000 crore) reported positive returns, with RoA of 1.88% and RoE of 7.36%, while all other categories recorded negative RoA. The asset quality showed improvement at the top end of the sector, whereas the growing tail of smaller institutions remained under stress. The RBI’s rate cuts benefitted mostly the larger and higher-rated NBFC-MFIs, and they have reported better profitability than the remaining. Thus, the sector’s recovery story, although real, is more due to the larger institutions than the sector-wide one.
1 Ministry of Statistics and Programme Implementation (MoSPI), Press Note on First Advance Estimates of National Income, 2025-26, released 7 January 2026 (FY2025-26 real GDP growth of 7.4%). Reserve Bank of India, Monetary Policy Committee statements, December 2025 and February 2026 (repo rate held at 5.25% in February 2026 following a 25-bps cut in December 2025; FY2025-26 retail inflation projected at 2.1%). See “India Holds Rates, Revises Up FY25/26 GDP Forecasts,” Trading Economics, 6 February 2026. https://www.mospi.gov.in/uploads/latestReleases/latest_release_1767781372753_1380ce82-f5a5-440d-99e6-e6b35af0deb5_GDP_Press_Note_on_FAE_2025-26.pdf ; https://tradingeconomics.com/india/interest-rate/news/523674
4.4.1 Surplus
At the end of FY2025-26, around 16% of MLIs reported negative operating profit, while 22% reported a negative net surplus. The aggregate operating profit stood at approximately ₹5,534 crores, with an overall positive net surplus of ₹662 crores, indicating an improvement in the sector’s overall financial position over the previous year. However, negative surpluses among several smaller and mid-sized MLIs continue to highlight sustainability and capital-absorption concerns. NBFC-MFIs recorded a positive net surplus of around ₹639 crores, while Pvt. Ltd. Companies reported a negative surplus of approximately ₹41 crores. Overall, the FY2025-26 data indicate a recovery in aggregate profitability, although financial pressures remain concentrated among certain institutions and size bands, echoing the same bifurcation seen in asset quality and returns.
4.4.2 Operational Self-Sufficiency (OSS2)
Operating efficiency remains an important consideration for MLIs as the institutions balance the need to maintain outreach and service delivery with the requirement to manage costs sustainably. In FY2025-26, the Operational Self-Sufficiency (OSS) ratio stood at 104%, indicating that operating income was sufficient to cover operating expenses, with a modest surplus of income over expenses. The past trend recorded a gradual strengthening of operating efficiency over the period of time, with the OSS ratio moving from 110% in 2018 to a peak of 122% in 2024, before moderating to 104% in both 2025 and 2026. As the business improves, we may see a better OSS ratio in the future. But the ratio remaining above 100% indicates that MLIs continued to maintain operational self-sufficiency. The moderation suggests that the sector’s operating income has remained adequate to meet its operating cost base, even as cost pressures have persisted. Going forward, maintaining this positive margin will depend on institutions’ ability to improve productivity, manage operating costs and sustain adequate income generation, particularly in an environment where growth is moderating and the underlying cost base remains relatively elevated.
2 OSS = (Total Income/Total Expenses) x100
Figure 4.4.1: Average OSS of MLIs over the years and its break-up between various categories
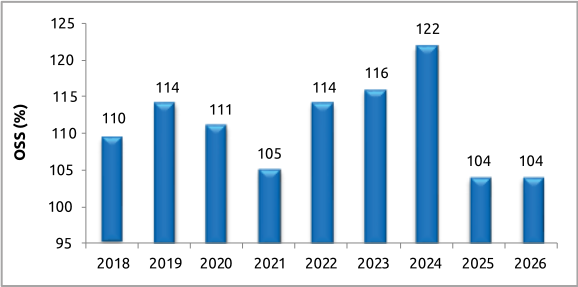
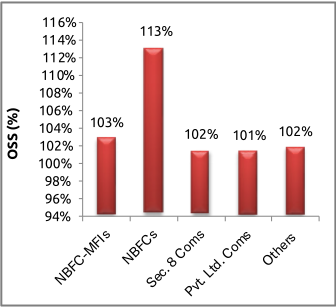
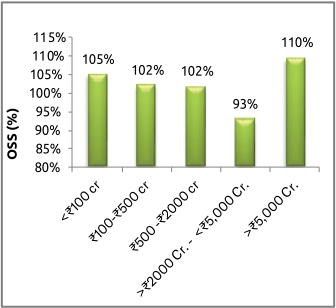
Across legal forms, the ratio was highest among NBFCs at 113%, followed by NBFC-MFIs at 103%, Section 8 Companies and Others at 102%, and Pvt. Ltd. Companies at 101%. By institution size, the ratio was highest among MLIs with AUM above ₹5,000 crore at 110%, while institutions with AUM between ₹2,000–₹5,000 crore recorded the lowest ratio at 93%. Variation across institution types and sizes suggests that operating efficiency depends not only on scale but also on institutions’ underlying cost structures and business models. The lower ratio among the ₹2,000–₹5,000 crore segment points to comparatively stronger cost absorption. Overall, the data highlights the need for continued cost optimisation and productivity improvements, particularly among institutions where operating expenses remain higher than operating income.
Analysing OSS against average loan outstanding per borrower is important for understanding how changes in loan size relate to the operating efficiency of MLIs. As loan sizes increase, institutions may benefit from economies of scale, which result in higher income per borrower. Examining this relationship therefore helps assess whether larger average loan sizes are translating into greater operating efficiency and better absorption of operating costs, and provides insight into the sustainability of different lending models.
Figure 4.4.2: OSS based on average loan outstanding per borrower
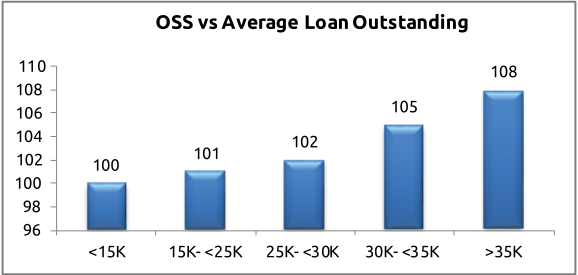
In FY2025-26, the Operating Self-Sufficiency (OSS) ratio showed a clear relationship with average loan outstanding, increasing progressively as average loan outstanding rose. MLIs with an average loan outstanding of less than ₹15,000 recorded an OSS ratio of 100%, while the ratio increased to 101% for ₹15,000–₹25,000, 102% for ₹25,000–₹30,000, 105% for ₹30,000–₹35,000 and 108% for loans above ₹35,000. Since OSS measures how much operating income covers operating expenditure, the rising ratio indicates that institutions with larger average loan sizes generated relatively higher operating income relative to their operating expenses. This may reflect greater income generation per borrower or loan account, improved revenue absorption of operating costs, and differences in portfolio composition and operating models. The trend suggests that higher average loan sizes were associated with stronger operating self-sufficiency, although the relationship may also reflect differences in pricing, portfolio quality, productivity, and institutional scale.
Analysing OSS against portfolio yield helps assess how effectively operating income from the portfolio translates into coverage of operating expenditure. Because OSS reflects an institution’s ability to meet operating expenses through operating income, a higher ratio indicates stronger operating self-sufficiency. Examining this relationship therefore helps determine whether higher portfolio yields are associated with greater income coverage of operating costs and whether institutions at different yield levels can maintain sufficient operating income to support ongoing operations.
Figure 4.4.3: OSS based on yield category
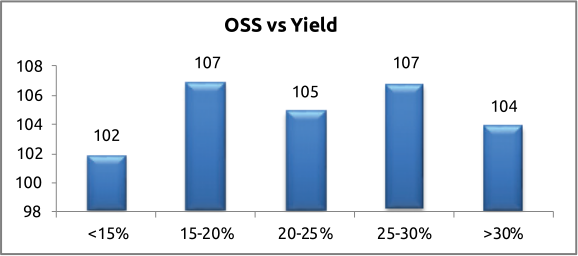
In FY2025-26, the OSS ratio remained above 100% across all yield categories. It was 102% for MLIs with yield below 15%, increased to 107% for the 15–20% yield category, and moderated slightly to 105% for 20–25%. The ratio then rose to 107% for 25–30% yield before falling to 104% among MLIs with yields above 30%. The pattern does not show a linear relationship between yield and operating efficiency, suggesting that higher portfolio yield by itself does not necessarily translate into proportionately better cost efficiency.
4.4.3 Profitability Ratios
Analysing Return on Assets (RoA) and Return on Equity (RoE) is important for assessing how effectively MLIs are using their capital to build better quality assets and wealth for investors. Together, these measures provide a broader view of profitability and financial sustainability, particularly when considered across portfolio size-wise.
Figure 4.4.4: Return on Assets (ROA) and Return on Equity (ROE) of MLI: Size-wise
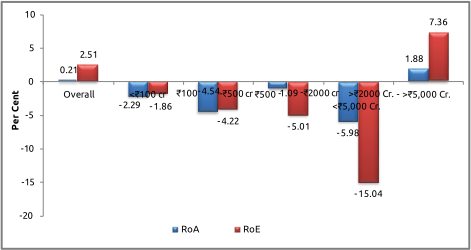
The relationship between institution size and RoA/RoE provides an important perspective on how scale is translating into profitability and returns on the capital employed. When viewed alongside the surplus position of MLIs, the distribution shows a clear differentiation between larger and smaller institutions.
The return profile closely reflects the surplus position across size categories. MLIs with AUM below ₹2,000 crore recorded negative RoA and RoE, indicating that the negative surplus reported among these segments translated into weaker returns on both assets and equity. The ₹2,000–₹5,000 crore category recorded the weakest performance, with RoA of -5.98% and RoE of -15.04%, pointing to significant profitability and capital-efficiency pressures. In contrast, Larger MLIs with AUM above ₹5,000 crore recorded positive RoA of 1.88% and RoE of 7.36%, consistent with their substantially stronger surplus position. The pattern suggests that scale is an important factor in the sector’s ability to absorb operating and financial costs and generate sustainable returns, with profitability increasingly concentrated among the largest institutions — the same institutions that, per Section 4.3, have captured the bulk of the benefit from the RBI’s recent rate cuts.
Box 4.4.1: Digital Collections through UPI: Modernizing Rural Loan Repayments
SATYA’s UPI-enabled collections are transforming the repayment experience for rural borrowers by making repayments more convenient, secure, and efficient. Through client-specific UPI QR codes, borrowers can make repayments directly from their mobile phones, reducing the need for cash handling, travel, and dependence on field officers. The introduction of UPI Autopay has further strengthened the initiative by enabling recurring repayments and promoting timely payments and financial discipline.
The initiative recorded more than ₹1,500 crore in cashless collections during FY 2025–26 across 26 States and Union Territories, reflecting the growing acceptance of digital payments in rural and semi-urban areas. Cashless collections have reduced risks related to theft, fraud, errors, and cash logistics, while enabling field staff to focus more on client engagement and financial literacy.
For rural women entrepreneurs, digital repayments have also emerged as an important tool for financial inclusion and empowerment. By using UPI, QR codes, mobile banking applications, and digital wallets, borrowers are gaining confidence in participating in the formal digital financial ecosystem. The initiative also supports sustainability by reducing paper usage and the environmental footprint associated with cash-based transactions.
With a vision to expand adoption to 10 million households by 2030, SATYA’s UPI-enabled collections demonstrate how technology, customer-centricity, and financial inclusion can come together to make rural finance more accessible, sustainable, and empowering.
Key Impact:
- Greater convenience & security through UPI-based, cashless repayments.
- Timely repayments enabled by UPI Autopay, supporting financial discipline.
- Improved field efficiency and greater focus on client engagement.
- Enhanced digital and financial inclusion, especially among rural women.
- Reduced paper use and cash-handling risks, supporting sustainability.
- Target: Reach 10 million households by 2030.
Courtesy: Satya MicroCapital Ltd.
Conclusion
The microfinance institutions can survive only if they have profitable operations. They should be able to have Operational Self-Sufficiency and also generate adequate income to have a positive ROA and ROE. This can only attract more investment in the sector, which will benefit the poorer households directly. The sector’s financial performance in FY2025-26 reflects a mixed but gradually improving picture, on the whole. But granular analysis indicates that this positiveness is due to the performance of larger institutions rather than a sector-wide phenomenon. It is very clear that the sector is in a growth phase which has to be supported by funds. If funds are made available, even smaller ones can perform positively and record better profitability ratios.
The analysis has shown that the larger MLIs demonstrated stronger capacity to absorb costs and generate returns, while several smaller and mid-sized institutions continued to face pressure on profitability, RoA and RoE. The analysis also indicates that higher loan size translates into better operating efficiency. Whereas such a correlation is not there with yield. Going forward, cost optimisation, productivity improvement, prudent growth and stronger financial management will remain important for strengthening the sustainability and resilience of MLIs, particularly if the current, unevenly distributed tailwind from lower funding costs does not persist or does not reach smaller institutions in time.
Chapter 4 Section V
Balance Sheet and Capital Structure
The Indian Accounting Standards (Ind AS) for asset classification and income recognition, anchored by a forward-looking Expected Credit Loss (ECL) model, rather than simple days-past-due metrics, has become an established part of how MLIs report and how auditors assess loan-loss provisioning, statistical assumptions, and management judgment. For auditors, this continues to widen the scope of review well beyond quantitative accuracy in financial statements, into the qualitative soundness of governance, board-approved policies on household income assessment, transparent pricing, and borrower protection, which remain central areas of scrutiny, in line with the RBI’s broader vision of responsible lending and sustainable financial inclusion.
After the contraction of the business portfolio witnessed in FY2024-25, when total assets fell by nearly 35% due to portfolio shrinkage, the sector staged a recovery in FY2025-26. MLI total assets rose by about 38% to ₹2,00,654 crore, with the loan portfolio continuing to account for the bulk of the asset base. Funding flows recovered as fresh equity raised grew by nearly 38% over the previous year, while outstanding borrowings rose by over 50%, reflecting a return of lender and investor confidence after a cautious FY2024-25. Importantly, this growth was accompanied by a stronger capital position: the median Capital Adequacy Ratio improved from about 33% to over 40%. At the same time, the debt-equity ratio eased from 2.3 to 1.76, pointing to more conservative leverage even as balance sheets expanded. The sections that follow examine these trends, assets, net owned funds, equity, debt funding, and capital adequacy, in greater detail.
4.5.1 Assets of MLIs
The amount of loans outstanding is the key asset for the microfinance institutions and is an indicator of the strength of the balance sheet. It reflects the cumulative value of loans held by borrowers at a given point in time and indicates changes in lending activity, portfolio growth, and the sector’s overall outreach. Examining the trend in loan amount outstanding over time helps to assess the sector’s long-term growth trajectory, periods of expansion or contraction, and its recovery following periods of stress or market adjustment. The following analysis presents the movement in total assets and highlights the significant changes observed in 2026.
Figure 4.5.1: MLI Total Assets- Yearly Trend
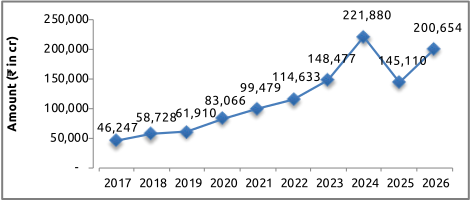
The trend shows a strong long-term expansion in the amount outstanding, rising from ₹46,247 crore in 2017 to ₹2,00,654 crore in 2026, representing more than a four-fold increase over the period. Growth was gradual during 2017–19, then accelerated steadily from ₹83,066 crore in 2020 to ₹1,48,477 crore in 2023. The amount peaked at ₹2,21,880 crore in 2024 before declining sharply to ₹1,45,110 crore in 2025. This contraction was followed by a strong comeback in 2026, with the amount rising about 38% year on year to ₹2,00,654 crore.
The recovery of 2026 indicates a substantial rebuilding of financial activity after the sharp correction in 2025. However, the amount outstanding still remains around 9.6% below the 2024 peak, suggesting that the sector has not yet fully returned to its earlier level. The sharp movements in the last two years may reflect changes in portfolio growth, funding availability, lending activity, institutional risk appetite and broader sectoral consolidation. Overall, the longer-term trajectory remains one of significant expansion, while the recent fluctuations indicate a period of adjustment followed by renewed growth in 2026.
Distribution of Assets
The asset composition of microfinance institutions shows how institutions deploy resources and how well assets remain aligned with the core lending business. Examining the distribution of assets across loan outstanding, liquidity, investments, fixed assets and other assets helps assess the sector’s business orientation, liquidity position and balance-sheet structure.
Figure 4.5.2: Composition of Total Assets of MLIs
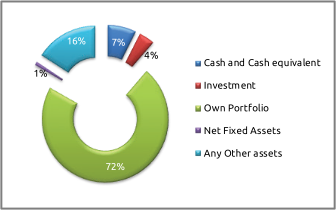
The asset composition of microfinance institutions is rightly concentrated in net loan outstanding, which accounts for 72% of total assets. This reflects the sector’s lending focus and indicates that most institutional resources remain deployed in the core credit portfolio. Other assets account for 16%, followed by cash and cash equivalents at 7% and investments at 4%, while net fixed assets constitute only 1%. Other assets include receivables and other financial assets, deferred tax, and intangible assets.
The high share of loans outstanding, close to three-fourths, is in the right direction, indicating the sector’s continued focus on credit delivery and financial inclusion. The 7% share for cash and cash equivalents indicates the liquidity buffer to meet operational and repayment-related requirements. The relatively modest share of investments suggests that institutions primarily deploy available resources towards their lending business rather than financial investments. Similarly, the low share of fixed assets is consistent with the relatively asset-light operating model of microfinance institutions. Overall, the asset structure indicates a predominantly credit-oriented and relatively liquid balance sheet, with limited capital tied up in physical infrastructure.
4.5.2 Funds for MLI operations
4.5.2.i Net Owned Fund
Net Owned Funds (NOF) represent the core capital base of a microfinance institution and measure its financial strength and capacity to absorb potential losses. Adequate NOF supports portfolio growth, meets regulatory requirements, and maintains the confidence of lenders, investors and other stakeholders. Tracking the level and composition of net owned funds therefore provides insight into the capital adequacy, resilience and growth capacity of institutions within the sector. Net Owned Funds for the MLIs as a whole for the financial year 2025-26 is at ₹33,184 crores. This is almost unchanged from the previous year.
4.5.2.ii Equity Outstanding
The microfinance sector’s equity base has expanded substantially over the past decade, indicating a significant strengthening of its capital base. Equity outstanding increased from ₹3,615 crore in 2017 to ₹40,837 crore in 2026, representing more than an eleven-fold increase. After fluctuations during 2017–21, equity growth accelerated significantly from ₹6,439 crore in 2022 to ₹13,188 crore in 2023, then rose further to ₹31,442 crore in 2024. The momentum continued in 2025 and 2026, with equity reaching ₹37,029 crore and ₹40,837 crore, respectively.
The sharp increase since 2023 suggests greater capital mobilisation and stronger institutional balance sheets, potentially supporting portfolio expansion, regulatory compliance, and the provision to absorb credit and operational losses. The more moderate growth in 2026, compared with the exceptionally large increases in 2023–25, may indicate a shift towards consolidation after significant capital strengthening. A stronger equity base also provides institutions with greater resilience amid portfolio-quality pressures and rising operating costs, while creating additional capacity to leverage external funding for sustainable growth. Overall, the sustained increase in equity indicates improved capital depth and financial resilience across the sector.
The distribution of equity outstanding shows a strong concentration among larger institutions and NBFC-MFIs, reflecting their scale and capital requirements. By portfolio size, institutions with portfolios above ₹5,000 crore account for ₹28,849 crore of equity, representing more than 70% of the sector’s total equity base. This is followed by institutions in the ₹2,000–5,000 crore category with ₹6,688 crore, while the ₹500–2,000 crore segment accounts for ₹3,089 crore. Smaller institutions have a relatively limited equity base, with ₹1,324 crore for the ₹100–500 crore category and ₹887 crore for institutions below ₹100 crore.
Figure 4.5.3: MLI Equity Outstanding - Yearly Trend and MLI-Category-wise Break-up of March 2026
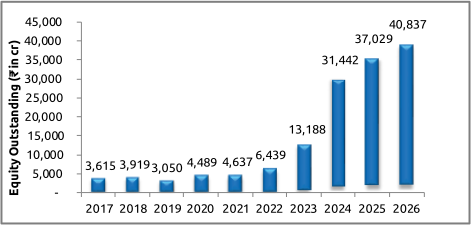
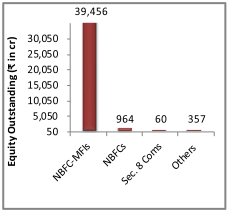
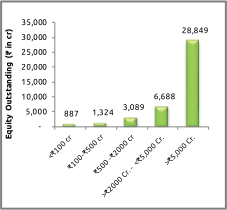
A similar concentration is evident across legal forms, with NBFC-MFIs accounting for the overwhelming majority of equity outstanding, while NBFCs1, Section 8 companies and other institutions hold comparatively small amounts. This concentration largely reflects NBFC-MFIs’ dominant share in the sector and their greater ability to attract institutional and external capital. Larger institutions’ stronger equity position gives them greater loss-absorption capacity, scope to leverage additional borrowings, and flexibility to support future portfolio growth. Conversely, the relatively smaller capital base of smaller MFIs may constrain their ability to scale and absorb periods of financial stress, highlighting the importance of strengthening diversified equity capital.
1 This analysis excludes some of the larger NBFCs like L&T and Bajaj, which have provided the self-reported data partially.
Fresh Equity Acquired
Equity mobilisation is an important indicator of the sector’s ability to attract fresh capital and strengthen its financial capacity. New equity gives institutions additional capital to support portfolio growth, absorb potential losses, meet regulatory requirements, and invest in technology, risk management, and operational infrastructure. Examining equity raised during the year, across legal forms and institutional size, provides insight into capital access, investor confidence and the capacity of different segments to support future growth.
Figure 4.5.4: Fresh Equity Raised by MLIs and MLI-Category-wise Break-up
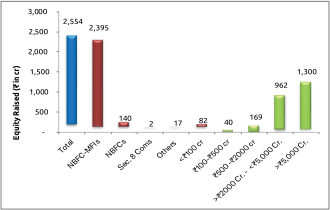
Equity raised in 2026 was ₹2,554 crore, with an overwhelming ₹2,395 crore (94%) mobilised by NBFC-MFIs, highlighting their dominant role in attracting fresh capital to the sector. NBFCs raised ₹140 crore, while Section 8 companies and other institutions together accounted for only a small share, which is expected as the nature of their operations more towards non-profit in nature. By portfolio size, equity mobilisation was strongly concentrated among larger institutions: entities with portfolios above ₹5,000 crore raised ₹1,300 crore, followed by those in the ₹2,000–5,000 crore category with ₹962 crore. Together, these two segments accounted for around 89% of total equity raised. In comparison, institutions below ₹2,000 crore collectively raised only ₹291 crore. This concentration suggests that larger institutions continue to have stronger access to equity capital, potentially supported by their scale, established track record, investor confidence and greater capacity to deploy additional capital. For smaller and mid-sized institutions, limited equity mobilisation may constrain their ability to strengthen capital buffers and expand portfolios, underscoring the importance of improving access to long-term and patient capital across the sector. In this regard, there is a need for public capital like IMEF in larger quantities. This will help the smaller institutions to grow bigger and become stronger to extend financial intermediation support to the poor.
4.5.2.iii Debt Funding
Since most of the MLIs are not allowed to mobilise deposits, debt funding becomes very important for microfinance operations. The funding structure of microfinance institutions is a key determinant of their liquidity, cost of funds and capacity to sustain lending operations. Given the sector’s reliance on external funding to support loan portfolios, the composition of liabilities provides insight into the extent of funding diversification and institutions’ access to different sources of finance. Examining the mix of borrowings, debt instruments, bonds, ECBs and other sources helps assess the sector’s funding resilience and ability to manage changing market conditions and funding costs.
Figure 4.5.5: Sources of funding based on types of instruments
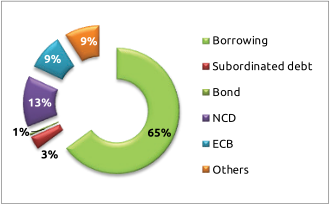
The funding structure indicates that borrowing from banks, DFIs and other financial institutions, remains the dominant source of external funding, accounting for 65% of total funds. This is followed by NCDs at 13%, while ECBs and other sources each contribute 9%. Subordinated debt accounts for 4%. This heavy reliance on borrowing highlights the sector’s continued dependence on bank and institutional finance to support lending operations. At the same time, the presence of ECBs, NCDs and other market-based instruments indicates some diversification of funding sources. A broader funding mix can help institutions manage liquidity and funding costs, although access to market-linked sources may vary significantly by institutional size and credit profile. Overall, the funding structure underscores the importance of diversifying liabilities and maintaining stable, cost-efficient sources of finance, particularly for smaller institutions that may have more limited access to capital markets.
The funding distribution by source indicates that the private sector is the largest provider of funds to microfinance institutions, accounting for 37% of total funding. This is followed by the public sector and other categories, contributing 15%, each. While NCDs account for 14%. NBFCs contribute a further 6%, with NABARD at 3%, MUDRA at 1%, and other financial institutions at 7%. SIDBI sources account for the remaining 2%.
Figure 4.5.6: Sources of funding based on Institution types
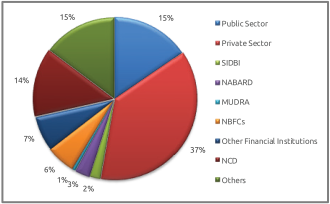
The composition reflects a diversified funding ecosystem, with both banks and financial institutions playing an important role alongside market-based debt instruments. The substantial private-sector contribution highlights the importance of commercial lenders in supporting microfinance operations. In contrast, the combined contribution of public-sector institutions and development-oriented lenders such as SIDBI and NABARD provides an important channel for institutional and potentially longer-term funding. The 14% share of NCDs also indicates growing relevance of market-based funding. Overall, the distribution suggests that the sector has access to multiple funding channels, which can help institutions manage liquidity and reduce dependence on any single source. At the same time, the dependence on borrowing still very high and the sector need to move into other market instruments to have better access to funding without relying on borrowing.
Borrowing outstanding has expanded substantially over the past decade, rising from ₹44,822 crore in 2016 to ₹1,29,128 crore in 2026. After a decline to ₹33,923 crore in 2017, borrowings increased steadily through 2020, with a temporary moderation in 2021. The pace of growth accelerated significantly thereafter, reaching ₹1,13,332 crore in 2023 and peaking at ₹1,30,044 crore in 2024. Borrowings fell sharply to ₹85,877 crore in 2025, then recovered strongly in 2026 to ₹1,29,128 crore, a 50.4% year-on-year increase.
The recovery of microlending towards the end of FY 2026 reflects on the renewed access to external funding following the contraction observed in 2025. The introduction of Credit Guarantee Scheme for MFI 2.0 in March 2026, may not have been made use of in FY 2026. But provide a positive sentiment to the funders.
The near return to the 2024 peak also suggests institutions have rebuilt their borrowing capacity to support lending operations and liquidity requirements. This trend aligns with the broader recovery in the sector’s outstanding portfolio and indicates continued reliance on external borrowings as the principal source of funding. At the same time, significant year-to-year fluctuations highlight the importance of maintaining diversified, stable funding channels to manage liquidity and funding-cost risks.
Figure 4.5.7: Outstanding Borrowings (₹ in Cr.) – Yearly Trend and MLI-Category-wise Break-up of 2026
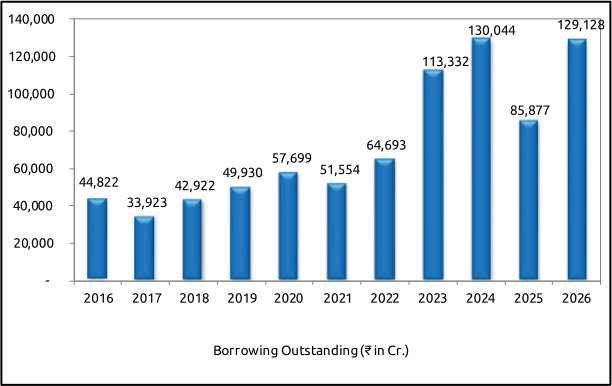
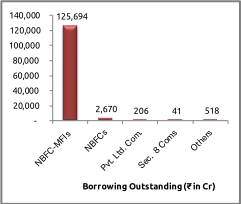
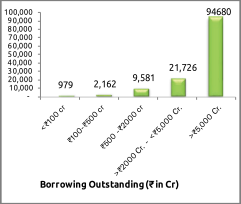
The distribution of borrowing outstanding in 2026 shows a strong concentration among NBFC-MFIs and the largest institutions. By legal form, NBFC-MFIs account for ₹1,25,694 crore, representing the overwhelming majority of total borrowings, while NBFCs account for ₹2,670 crore and other legal forms contribute relatively small amounts. By portfolio size, institutions with portfolios above ₹5,000 crore hold ₹94,680 crore of borrowings, followed by the ₹2,000–5,000 crore category at ₹21,726 crore and the ₹500–2,000 crore category at ₹9,581 crore. Together, institutions ‘above ₹2,000 crore’ account for most outstanding borrowings.
This concentration reflects larger MLIs’ scale of operations and greater access to institutional funding. Larger institutions are likely to have stronger credit profiles, established lender relationships and greater ability to access diverse funding instruments. In contrast, smaller institutions have significantly lower outstanding borrowings, which may reflect smaller portfolios and comparatively limited access to large-scale institutional finance. The distribution also reinforces the sector’s dependence on NBFC-MFIs as the principal borrowers and highlights the need to diversify funding and improve access to competitive finance for smaller and mid-sized institutions.
Borrowing Received
The microfinance sector received ₹1,07,081 crore by way of borrowings during FY 2026, with NBFC-MFIs accounting for ₹1,05,208 crore, or nearly 98% of total borrowing received. NBFCs received ₹1,553 crore, while other legal forms accounted for relatively small amounts. The concentration is similarly pronounced by institutional size, with institutions having portfolios above ₹5,000 crore receiving ₹86,532 crore, followed by the ₹2,000–5,000 crore category at ₹12,789 crore and the ₹500–2,000 crore category at ₹6,391 crore.
Figure 4.5.8: Fund Received during the year and MLI-Category-wise Break-up of 2026
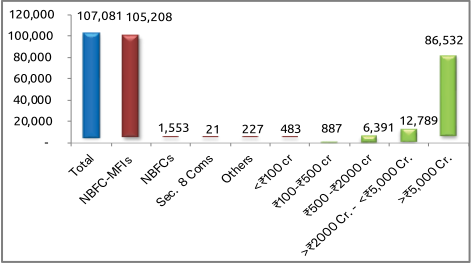
The distribution indicates that larger institutions continue to attract most fresh debt funding, reflecting that the small and medium ones have still to gain the confidence of the funders. The CGSMFI 2.0 is likely to change this sentiment. The strong concentration of borrowing among larger NBFC-MFIs also reflects the sector’s structure, where these institutions account for most lending activity. Overall, the data indicate strong mobilisation of debt funding in FY 2026, while highlighting the continuing need to broaden access to stable and competitively priced debt for smaller and mid-sized institutions.
Table 4.5.1 and Figure 4.5.9 below illustrate the debt received by MLIs from various source types.
Table 4.5.1: Source wise fund received (in ₹ Cr.) by different entities during the year
| Public Sector Banks | Private Sector Banks | SIDBI | NABARD | NBFCs | Other Fin. Ints. | NCDs | Any Others | |
|---|---|---|---|---|---|---|---|---|
| NBFC-MFIs | 15,893 | 51,548 | 1,214 | 1,558 | 7,075 | 2,643 | 7,366 | 17,910 |
| NBFCs | 70 | 220 | - | - | 421 | 23 | 194 | 626 |
| Pvt. Ltd. Com. | 2 | 1 | - | - | 37 | 27 | - | 5 |
| Sec. 8 Coms | 8 | - | 2 | - | 1 | 8 | 0.20 | 1 |
| Others | 37 | 4 | 0.25 | - | 0.30 | 107 | - | 79 |
| Total | 16,010 | 51,773 | 1,217 | 1,558 | 7,535 | 2,808 | 7,560 | 18,621 |
Figure 4.5.9 : Source-wise Share of Loans lent among Different Legal Forms of MLIs during 2025-26
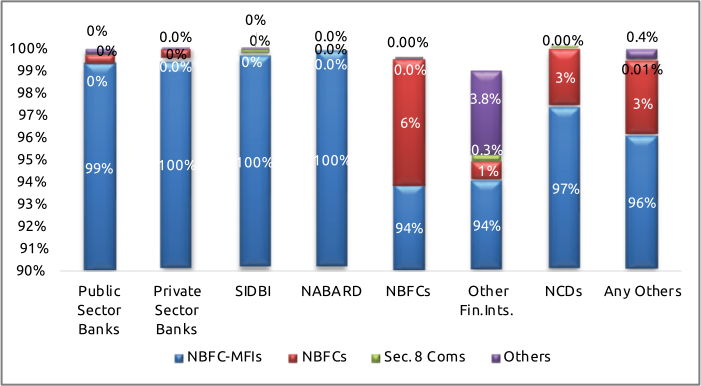
Major lenders to MLIs during 2025-26
The tables below list the major lenders (based on the information received for the top 10 lenders for each institution) that provide debt funds to MLIs.
Table 4.5.2 (a): List of banks that lent to MLIs as of March 2026 (Based on the Top 10 lenders out of the total)
| Sl. No. | Name of Lenders | No. of MLIs |
|---|---|---|
| 1 | Assam Cooperative Apex Bank (ACAB) | 1 |
| 2 | Assam Gramin Vikash Bank | 1 |
| 3 | AU Small Finance Bank | 3 |
| 4 | Axis Bank Ltd. | 10 |
| 5 | Bandhan Bank Ltd. | 8 |
| 6 | Bank of Baroda | 10 |
| 7 | Bank of Maharashtra | 6 |
| 8 | Canara Bank | 2 |
| 9 | City Union Bank | 1 |
| 10 | CSB Bank Ltd. | 1 |
| 11 | DBS Bank India Ltd. | 2 |
| 12 | DCB Bank Ltd. | 4 |
| 13 | District Central Co-operative Bank | 1 |
| 14 | Equitas Small Finance Bank | 1 |
| 15 | ESAF Small Finance Bank | 1 |
| 16 | Federal Bank Ltd. | 7 |
| 17 | HDFC Bank Ltd. | 3 |
| 18 | HSBC Bank Ltd. | 7 |
| 19 | ICICI Bank Ltd. | 8 |
| 20 | IDBI Bank Ltd. | 4 |
| 21 | IDFC First Bank Ltd. | 18 |
| 22 | Indian Bank | 1 |
| 23 | Indian Overseas Bank | 7 |
| 24 | IndusInd Bank Ltd. | 2 |
| 25 | Jana Small Finance Bank | 6 |
| 26 | Karur Vysya Bank | 3 |
| 27 | Kotak Mahindra Bank Ltd. | 2 |
| 28 | NABARD | 1 |
| 29 | NE Small Finance Bank | 1 |
| 30 | Pudhuvai Bharathiyar Grama Bank | 1 |
| 31 | Punjab & Sind Bank | 1 |
| 32 | RBL Bank Ltd. | 3 |
| 33 | REPCO Bank | 1 |
| 34 | SBM Bank Ltd. | 2 |
| 35 | Shivalik Small Finance Bank | 1 |
| 36 | SIDBI | 9 |
| 37 | Standard Chartered Bank | 4 |
| 38 | State Bank of India | 21 |
| 39 | State Bank of Mauritius | 2 |
| 40 | Suryoday Small Finance Bank | 1 |
| 41 | Tamil Nadu Grameen Bank | 1 |
| 42 | The Assam Co-operative Apex Bank Ltd. | 1 |
| 43 | UCO Bank Ltd | 4 |
| 44 | Union Bank of India | 9 |
| 45 | West Bengal Gramin Bank | 2 |
| 46 | Yes Bank Ltd. | 6 |
Table 4.5.2 (b): List of other lenders who lent to MLIs as of March 2026 (Based on the Top 10 lenders out of the total)
| Sl. No. | Name of Lenders | No. of MLIs |
|---|---|---|
| 1 | AK Capital Services Ltd. | 1 |
| 2 | Ambium Finserve Pvt. Ltd. | 1 |
| 3 | Annapurna Finance Pvt. Ltd. | 4 |
| 4 | Archbridge Capital Pvt. Ltd. | 1 |
| 5 | Arohan Financial Services Ltd. | 20 |
| 6 | Assam Finance Corporation (AFC) | 4 |
| 7 | Asvanta Financial Consultants Pvt. Ltd. | 2 |
| 8 | Aurukshaya Consultants Pvt. Ltd. | 1 |
| 9 | Avanti Finance Pvt. Ltd. | 2 |
| 10 | Baid Finserv Ltd. | 2 |
| 11 | Bajaj Finance Ltd. | 1 |
| 12 | Barclays Bank PLC | 1 |
| 13 | Blacksoil Capital Pvt. Ltd. | 3 |
| 14 | Blue Orchard Microfinance Fund | 2 |
| 15 | Carron Capital LLP | 1 |
| 16 | Caspian Investments Pvt. Ltd. | 1 |
| 17 | Concard Financiers Pvt. Ltd. | 1 |
| 18 | Creation Investments Capital Management | 1 |
| 19 | Electronica Finance Ltd. | 1 |
| 20 | Finstars Capital Ltd. | 1 |
| 21 | Floras | 1 |
| 22 | FMO | 1 |
| 23 | Fuherer Capital Pvt. Ltd. | 1 |
| 24 | FWWB | 18 |
| 25 | Global Gender Smart Fund (Incofin) | 1 |
| 26 | Godavari Urban Multistate Credit Co-operative Society | 1 |
| 27 | Gosree Finance | 1 |
| 28 | Grip Invest Technologies Pvt. Ltd. | 3 |
| 29 | Hero FinCorp Ltd. | 1 |
| 30 | Hindon Mercantile Ltd. | 1 |
| 31 | Hinduja Leyland Finance | 1 |
| 32 | IBL Finance Ltd. | 3 |
| 33 | IFMR Fimpact | 1 |
| 34 | IIX Global | 1 |
| 35 | InCred Financial Services Ltd. | 2 |
| 36 | Infina Finance Pvt. Ltd.(IFPL) | 1 |
| 37 | IRIS | 1 |
| 38 | Jackson Commercial Pvt. Ltd. | 1 |
| 39 | Janasha Finance Pvt. Ltd. | 1 |
| 40 | Jeevan Utthan Financial Services Pvt. Ltd. | 2 |
| 41 | Kaleidofin Capital Pvt. Ltd. | 4 |
| 42 | Kamdhenu Financial Services Pvt. Ltd. | 1 |
| 43 | Karnataka State Financial Corporation | 1 |
| 44 | Kashi Vishwanatha Vidya Samasthe | 1 |
| 45 | Kiara Microcredit | 1 |
| 46 | Kissandhan Agri Financial Services Pvt. Ltd. | 2 |
| 47 | Kiyansh Finance Pvt. Ltd. | 2 |
| 48 | Kula International | 1 |
| 49 | Lord Fincap Ltd. | 1 |
| 50 | Maanaveeya Development & Finance Pvt. Ltd. | 6 |
| 51 | Manappuram Finance Ltd | 1 |
| 52 | MAS Financial Services Ltd. | 13 |
| 53 | Microfinance Solidaire | 1 |
| 54 | MILAAP | 3 |
| 55 | Money Wise Financial Services Pvt. Ltd. | 2 |
| 56 | Moringway | 1 |
| 57 | Mufin Green Finance Ltd. | 1 |
| 58 | Muthoot Microfin Ltd. | 1 |
| 59 | NABFINS Ltd. | 3 |
| 60 | NABKISAN Finance Ltd. | 2 |
| 61 | Naman Finlease Ltd. | 1 |
| 62 | National Cooperative Development Corporation (NCDC) | 2 |
| 63 | NEDFi | 7 |
| 64 | Neo Markets Services Pvt. Ltd. | 1 |
| 65 | Nipha Finance Pvt. Ltd. | 1 |
| 66 | NKC Finance Pvt. Ltd. | 2 |
| 67 | Northern Arc Capital Ltd. | 13 |
| 68 | Nova Vyapar Pvt. Ltd. | 1 |
| 69 | OXY Venture | 1 |
| 70 | Oxyzo Financial Services Ltd. | 3 |
| 71 | PAFT Finance Ltd. | 1 |
| 72 | Pagasa Consultancy Pvt.Ltd. | 1 |
| 73 | Phillip Capital | 1 |
| 74 | Pinoy Consultancy Pvt. Ltd. | 1 |
| 75 | Piramal Finance Ltd. | 4 |
| 76 | Rajputana Investment and Finance Ltd. | 1 |
| 77 | RAR Fincare Ltd | 7 |
| 78 | Real Touch Finance Ltd. | 1 |
| 79 | ResponsAbility | 1 |
| 80 | Rockland Finstock Ltd. | 1 |
| 81 | Sabrimala Fintech Pvt. Ltd. | 2 |
| 82 | Sahabhagi Services Pvt. Ltd. | 1 |
| 83 | Saidhan Mercantile Pvt. Ltd. | 1 |
| 84 | Samunnati Services Pvt.Ltd. | 1 |
| 85 | SAS Finserv Pvt. Ltd. | 1 |
| 86 | Satin Creditcare Network Ltd. | 1 |
| 87 | SAVE Solutions Pvt. Ltd. | 1 |
| 88 | Share Bazar Financial Pvt. Ltd. | 1 |
| 89 | Shine Star Build Cap Pvt. Ltd. | 2 |
| 90 | Shriram Finance Ltd. | 11 |
| 91 | SK Finance Ltd. | 1 |
| 92 | SV Creditline Ltd. | 1 |
| 93 | Tamilnadu Industrial Investment Corporation (TIIC) Ltd. | 1 |
| 94 | Tata Capital Ltd. | 3 |
| 95 | The Kangra Central Co-op Bank Ltd. | 1 |
| 96 | Tipsons Consultancy Services Pvt. Ltd. | 1 |
| 97 | Triodos Investment Management BV | 1 |
| 98 | Tuvis Services | 1 |
| 99 | UC Inclusive Credit Pvt.Ltd. | 9 |
| 100 | Usha Financial Services Pvt. Ltd | 8 |
| 101 | UTI Responsibility | 1 |
| 102 | Viridian Capital and Financial Services Pvt. Ltd. | 2 |
| 103 | Vivriti Capital Pvt. Ltd. | 10 |
| 104 | Western Capital Advisors Pvt. Ltd. | 1 |
| 105 | Wint Wealth | 1 |
| 106 | WLB Asset Vii PTE Ltd . | 1 |
4.5.3 Capital to Risk Weighted Asset Ratio
The trend shows a significant increase in the indicator from 2018 to 2026, rising from 22.1% to 40.23%. After remaining broadly stable around 21–23% during 2018–20, it increased sharply to 28.41% in 2021. The ratio then moderated slightly during 2022–24, remaining in the range of 26.47–28.00%, before accelerating to 32.94% in 2025 and reaching 40.23% in 2026.
Figure 4.5.10: Capital to Risk-Weighted Asset Ratio
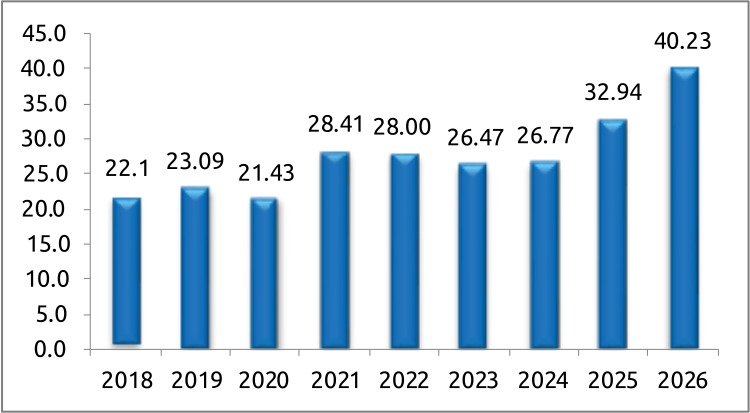
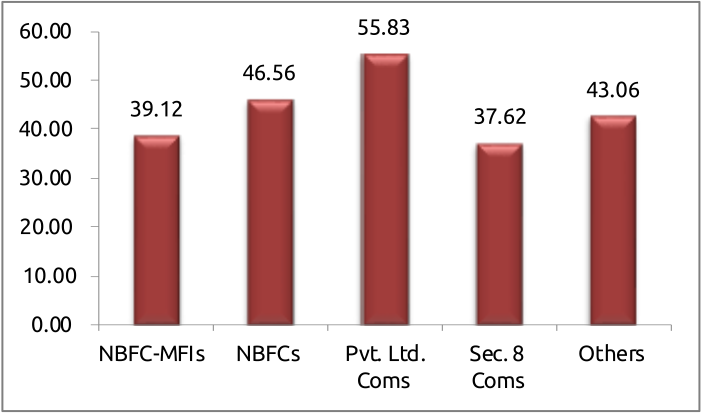
The sharp increase in the ratio from 32.94% in 2025 to 40.23% in 2026 can be viewed in the context of the sector’s changing balance-sheet dynamics during FY2025–26. The increase was broadly driven by contraction in the loan portfolio alongside a strengthening of the equity base. As portfolio size moderated, equity’s relative weight in the overall financial structure increased. At the same time, the sector could also mobilise significant fresh equity amounting to ₹2,554 crore in FY 2026.
This combination of a reduced portfolio and increased equity resulted in a northward movement of the ratio. The movement therefore reflects a change in the denominator and capital strengthening by institutions. But this trend was concentrated mostly in larger NBFC-MFIs.
4.5.4 Leverage / Debt – Equity Ratio
The Debt-Equity ratio measures the extent to which MFIs finance their assets through borrowed funds compared to shareholders’ equity. Since MFIs primarily operate by mobilising debt from banks, NBFCs, and capital markets, a higher ratio reflects greater reliance on external borrowings. While leveraging debt helps expand outreach and scale loan portfolios quickly, excessive dependence on debt increases financial risk and vulnerability to interest rate fluctuations. Regulators and lenders often prescribe prudent debt-equity thresholds to ensure stability. Figure 4.5.11 depicts the weighted-average Debt-Equity ratio across segments.
Figure 4.5.11: Debt-Equity Ratio for All MLIs and Break–up of FY 2025-26 across MLI – Categories
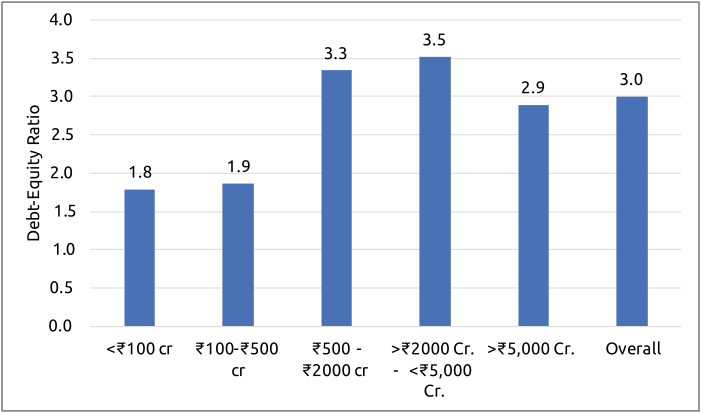
Conclusion
The analysis of the sector’s capital and funding structure highlights a significant strengthening of microfinance institutions’ financial base in FY 2026. While the sector predominantly relies on borrowings to support its lending operations, the year also witnessed quite a significant equity mobilisation, with ₹2,554 crore of fresh equity raised. This strengthened institutions’ capital position at a time when portfolio growth has moderated.
Funding remains highly concentrated among NBFC-MFIs and larger institutions, which continue to have greater access to debt and equity capital. The increase in the equity-to-asset position during FY 2026 reflects the combined effect of portfolio contraction and stronger equity mobilisation, indicating a more capitalised balance sheet.
Overall, funding trends suggest a shift toward greater capital resilience and financial consolidation, although access to stable, competitively priced funding remains more constrained for smaller and mid-sized institutions. Going forward, diversifying funding sources, expanding access to long-term capital, and prudent leverage management will be important to support sustainable portfolio growth while maintaining financial resilience.