


Chapter 2The State of Microcredit: A Panoramic View of the Microfinance Sector
In the year 2025-26, the microfinance sector navigated a year of de-growth and sluggishness, marking the transition from a prolonged phase of portfolio stress and de-growth to consolidation and an early stage of growth recovery. The loan outstanding of the sector stood at ₹3,33,907 Cr. in 1,040 lakh loan accounts as of 31st March 2026.


The State of Microcredit: A Panoramic View of the Microfinance Sector
2.1 Sector Overview
In the year 2025-26, the microfinance sector navigated a year of de-growth and sluggishness, marking the transition from a prolonged phase of portfolio stress and de-growth to consolidation and an early stage of growth recovery. The loan outstanding of the sector stood at ₹3,33,907 Cr.1 in 1,040 lakh loan accounts as of 31st March 2026. Thus, a sector that had made rapid growth after the COVID pandemic saw a year of consolidation and stabilisation.
On a year-on-year basis, loan outstanding contracted by 11% between March 2025 and March 2026. The de-growth trend that had persisted for almost eight consecutive quarters saw a turnaround in the last quarter, with 4% credit expansion over December 2025, the first positive movement since the June 2024 quarter.
The improvement in growth momentum has been accompanied by a marked strengthening of asset quality. The sector-wide PAR 30-179 DPD improved from 6.63% in March 2025 to 2.34% in March 2026, a moderation of 429 basis points, suggesting that the consolidation phase of the preceding two years has successfully established a sounder credit foundation.
The March 2026 data shows that early-stage asset quality has improved substantially across all lender categories, with PAR 30-179 DPD, PAR 60-179 DPD and PAR 90-179 DPD improving significantly from March 2025 levels. The up-to-24-Month On Book (MOB) portfolio, PAR 180+ DPD remained higher for Banks at 9.3% and SFBs at 8.2%, compared to 3.7% for NBFC-MFIs and 2.2% for NBFCs. The stress is relatively higher for Banks and SFBs, whereas NBFC-MFIs and NBFCs appear to have stronger performance for loans within their last 24-month period.
Overall, the March 2026 trend points to improving credit performance and reduced fresh slippages, but the elevated PAR 180+ DPD within the 24-MOB portfolio of Banks and SFBs indicates that deeper delinquency remains a concern in these segments. The relatively low PAR 180+ DPD levels for NBFC-MFIs and NBFCs suggest better vintage-level portfolio performance and stronger containment of delinquency, although continued monitoring will be important as the current vintages mature.
This chapter analyses the overall status of the microfinance sector using data obtained from Equifax India, a leading Credit Information Company. The analysis encompasses information from all micro-lenders operating nationwide, including Banks, Small Finance Banks (SFBs), NBFC-MFIs, NBFCs, and Others2.
Table 2.1 Microfinance Sector Snapshot as of 31st March 2026
| Parameter | Micro-Lender | As of 31st March 2026 | Micro-Lender Share (in %) | Y-o-Y Growth (in %) |
|---|---|---|---|---|
| Loan Outstanding (in ₹ Cr.) | NBFC-MFIs | 1,41,663 | 42% | -1% |
| Banks | 85,299 | 26% | -29% | |
| NBFCs | 46,155 | 14% | -0.1% | |
| SFBs | 50,725 | 15% | -13% | |
| Others | 10,064 | 3% | 49% | |
| Sector | 3,33,907 | -11% | ||
| Number of Loan Accounts (in lakhs) | NBFC-MFIs | 435 | 42% | -16% |
| Banks | 311 | 30% | -30% | |
| NBFCs | 98 | 9% | -20% | |
| SFBs | 160 | 16% | -24% | |
| Others | 36 | 3% | 50% | |
| Sector | 1,040 | -21% | ||
| Micro-Lender | During FY 2025-26 | Micro-Lender Share (in %) | Y-o-Y Growth (in %) | |
| Amount Disbursed during FY 2025-26 (in ₹ Cr.) | NBFC-MFIs | 1,12,782 | 45% | 8% |
| Banks | 60,049 | 24% | -34% | |
| NBFCs | 39,938 | 16% | 13% | |
| SFBs | 32,807 | 13% | -6% | |
| Others | 3,458 | 1% | -38% | |
| Sector | 2,49,034 | -8% |
Source: Equifax India
1 Cr. and Crore have been used interchangeably throughout this entire report.
2 Others refers to Cooperative Banks, Local Area Banks, Sec. 8 Companies, Nidhi Companies, etc.
The data indicates that NBFC-MFIs are the single largest lender category on every dimension measured, accounting for 42% of loan outstanding and loan accounts, and 45% of disbursement value during FY 26. Banks, notwithstanding their retreat over the year, retain the second-largest exposure by loan outstanding, followed by SFBs, NBFCs, and the Others category of micro-lenders.
2.1.1 Key Performance Highlights
Loan Outstanding: The sector’s loan outstanding stood at ₹3,33,907 Cr. as of March 2026, a decline of 11% year-on-year. The year-on-year decline reflects the careful approach adopted by MLIs, overcoming the stress cycle through repayments, write-offs and tighter guardrails, etc. Whereas the sequential uptick signals that new originations have begun to outpace portfolio run-off, marking the onset of a fresh growth phase.
Loan Accounts: Loan accounts totalled 1,040 lakhs as of March 2026. Combined with a loan outstanding of ₹3,33,907 Cr., this implies an average outstanding balance of approximately ₹32,116 per account, an indicator of the extent to which the sector has migrated toward higher ticket lending relative to previous years.
Disbursement: Loan disbursement in the microfinance sector continued its de-growth trend through FY 2025-26, though the pace of contraction eased markedly by year-end. The sector-wide disbursement contracted by 21% in volume and 8% in value between FY 2024-25 and FY 2025-26, even as the loan outstanding itself declined by 11%, indicating lenders wrote fewer but comparatively larger loans through the year.
Asset Quality: The PAR 30-179 DPD improved to 2.34% in March 2026 from 6.63% a year earlier, while PAR 90-179 DPD stood at 1.45%. This improvement was achieved partly through stronger collections on the current book, and partly through write-offs, though the PAR 180+ DPD continued to rise, indicating that legacy stressed assets are still being worked through.
Average Ticket Size (ATS): Average Ticket Size rose to ₹59,473 during FY 2025-26, up from ₹50,918 during FY 2024-25, a Y-o-Y increase of 17%. Over a five-year horizon, ATS has risen from ₹36,510 in FY 2020-21 to ₹59,473 in FY 2025-26, indicating a structural shift toward higher-value lending to established borrowers.
Average Loan Outstanding per Account: At ₹32,116 per loan account (derived from loan outstanding of ₹3,33,907 Cr. over 1,040 lakh loan accounts), average outstanding balances remain moderate relative to ATS, reflecting the amortising nature of microfinance loans and continued repayment discipline even through the stress cycle.
2.2 Loan Accounts
2.2.1 Number of Loan Accounts (in lakhs)
Figure 2.1: Market Share of Micro-Lenders in terms of Loan Accounts (in %)
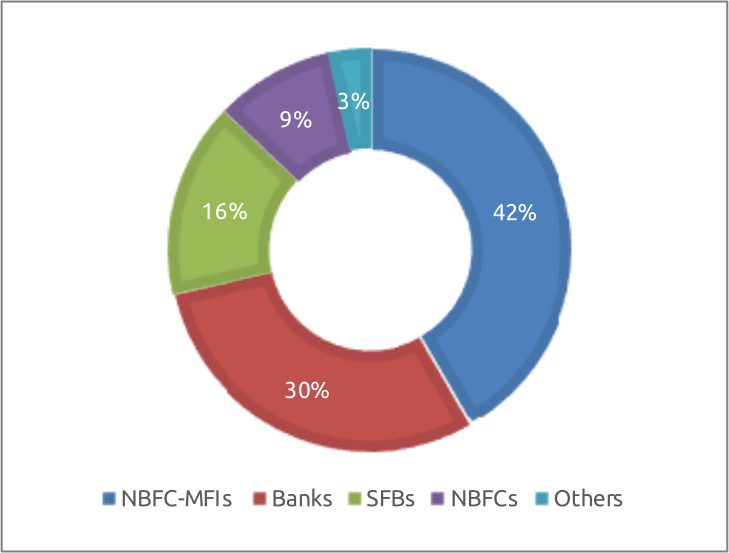
As of March 31, 2026, the total number of loan accounts serviced by all micro-lenders stood at 1,040 lakh loan accounts. The NBFC-MFIs maintained the largest market share with 435 lakh loan accounts, representing 42%, followed by Banks with 311 lakh loan accounts (30%). Small Finance Banks (SFBs) serviced 160 lakh loan accounts (16%), NBFCs accounted for 98 lakh loan accounts (9%), and Other lenders comprised 36 lakh loan accounts (3%). On a year-on-year basis, only the ‘Others’ category registered positive growth in loan accounts at 50%, whereas all other micro-lender categories experienced declines: Banks (-30%), SFBs (-24%), NBFCs (-20%), and NBFC-MFIs (-16%).
Figure 2.2: Y-o-Y Growth (in %) in Number of Loan Accounts (in lakhs) across micro-lenders
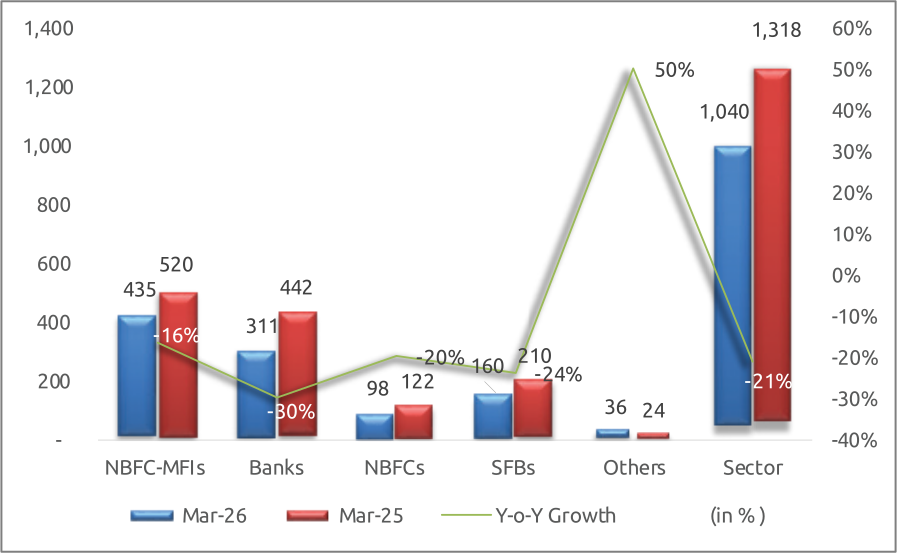
As of 31st March 2026, the total loan account base for the microfinance sector is 1,040 lakhs, posting a Y-o-Y decline of 21%. All the micro-lenders except for Other Lenders have posted negative growth, including Banks (-30%), SFBs (-24%), NBFCs (-20%), and NBFC-MFIs (-16%), respectively.
Following years of rapid expansion, an uptick in delinquencies has led the micro-lenders to adopt a more cautious, quality-first approach to credit. As a result, both the volume of loans disbursed and total outstanding balances declined, reflecting a broader sectoral shift toward stronger risk controls and sustainable portfolio growth over short-term expansion.
This change was also prompted by the RBI regulations for responsible lending and the guardrails issued by the SROs for reducing overleverage and bringing the sector back to a better shape. As a result of this, there has been an improvement in terms of the number of micro-lenders per borrower, which can be observed from the following table:
Table 2.2 Distribution of Unique Active Borrowers across the number of micro-lenders as of March 2026 and March 2025
| Active Lender Associations | Unique Active Borrowers (in %) as of March 2026 | Unique Active Borrowers (in %) as of March 2025 |
|---|---|---|
| <=2 | 92.6% | 90.5% |
| 3 | 6.6% | 5.6% |
| 4 | 0.7% | 2.3% |
| >=5 | 0.1% | 1.6% |
The improvement in borrower-level risk profile is evidenced by Table 2.2. Adherence to SRO-mandated guardrails restricting borrower association to no more than 3 micro-lenders (and capping total household indebtedness at ₹2,00,000) resulted in 92.6% of unique active borrowers being associated with 2 or fewer lenders as of March 2026 (up from 90.5% in March 2025). High-risk multi-lending (5 lenders or more) reduced significantly from 1.6% to a negligible 0.1%.
2.2.2 State/UT-wise No. of Loan Accounts (in lakhs)
Table 2.3 depicts the loan accounts serviced across various States and Union Territories. A year-on-year analysis indicates that 33 States and UTs experienced a decline in the number of loan accounts. In contrast, three North Eastern states—Nagaland (18%), Arunachal Pradesh (7%), and Meghalaya (1%), registered an increase, although their overall share in the microfinance sector remains minimal. Notably, the principal states with the highest loan outstanding, including Karnataka (-28%), West Bengal (-24%), Tamil Nadu (-23%), Bihar (-22%), Uttar Pradesh (-17%), etc., saw a contraction in the number of loan accounts, reflecting broad-based caution across the board and in these states in particular.
Table 2.3 Loan Accounts (in lakhs) of all micro-lenders across States/UTs – March 2026 and March 2025 (in descending order of Loan Accounts)
| Sl. No. | State/UT | March 2026 (in lakhs) |
March 2025 (in lakhs) |
Y-o-Y Growth (in %) |
|---|---|---|---|---|
| 1 | Bihar | 154.47 | 197.60 | -22% |
| 2 | Uttar Pradesh | 120.66 | 145.25 | -17% |
| 3 | Tamil Nadu | 113.14 | 146.02 | -23% |
| 4 | West Bengal | 89.65 | 118.22 | -24% |
| 5 | Karnataka | 88.45 | 123.00 | -28% |
| 6 | Maharashtra | 82.48 | 105.11 | -22% |
| 7 | Madhya Pradesh | 63.60 | 77.55 | -18% |
| 8 | Odisha | 61.65 | 80.69 | -24% |
| 9 | Rajasthan | 42.86 | 54.87 | -22% |
| 10 | Jharkhand | 35.19 | 41.61 | -15% |
| 11 | Keralam | 29.44 | 40.29 | -27% |
| 12 | Gujarat | 28.75 | 38.41 | -25% |
| 13 | Andhra Pradesh | 22.31 | 24.71 | -10% |
| 14 | Assam | 22.11 | 24.20 | -9% |
| 15 | Chhattisgarh | 18.75 | 23.64 | -21% |
| 16 | Punjab | 16.95 | 18.82 | -10% |
| 17 | Telangana | 16.80 | 17.46 | -4% |
| 18 | Haryana | 14.72 | 18.18 | -19% |
| 19 | Tripura | 4.67 | 6.53 | -29% |
| 20 | Uttarakhand | 4.43 | 6.05 | -27% |
| 21 | Puducherry | 2.48 | 3.12 | -20% |
| 22 | Delhi | 1.47 | 1.90 | -23% |
| 23 | Others3 | 1.46 | 0.63 | 132% |
| 24 | Meghalaya | 0.52 | 0.52 | 1% |
| 25 | Himachal Pradesh | 0.50 | 0.58 | -12% |
| 26 | Mizoram | 0.37 | 0.41 | -10% |
| 27 | Arunachal Pradesh | 0.35 | 0.33 | 7% |
| 28 | Goa | 0.35 | 0.57 | -40% |
| 29 | Jammu & Kashmir | 0.27 | 0.31 | -13% |
| 30 | Sikkim | 0.24 | 0.36 | -34% |
| 31 | Manipur | 0.22 | 0.33 | -32% |
| 32 | Nagaland | 0.21 | 0.18 | 18% |
| 33 | Chandigarh | 0.12 | 0.13 | -10% |
| 34 | Andaman & Nicobar Islands | 0.04 | 0.05 | -16% |
| 35 | Dadra and Nagar Haveli and Daman and Diu | 0.02 | 0.02 | -28% |
| 36 | Lakshadweep | 0.0000 | 0.0001 | -33% |
| 37 | Ladakh | 0.00 | 0.00 | -100% |
| Sector | 1,040 | 1,318 | -21% |
3 The unmapped states and districts within the geo master have been assigned to the ‘Others’ category.
2.3 Loan Outstanding Analysis
2.3.1 Loan Outstanding (in ₹ Cr.)
Figure 2.3: Loan Outstanding (in ₹ Cr.) across micro-lenders
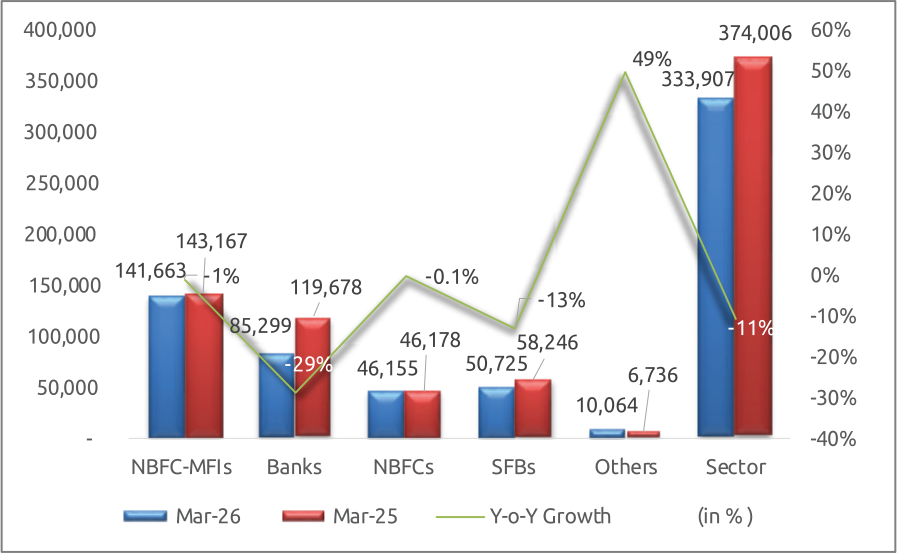
The sector’s loan outstanding contracted from ₹3,74,006 Cr. in March 2025 to ₹3,33,907 Cr. in March 2026, reflecting a decline of 11%. Every lender category except Other lenders recorded a year-on-year decline in loan outstanding, though the magnitude of decline varied sharply: Banks contracted by (-29%), the steepest among all categories, followed by SFBs at (-13%), while NBFC-MFIs and NBFCs contracted by only (-1%) and (-0.1%), respectively. One of the probable reasons for the decline in loan outstanding is the imposition of stricter guardrails by the SRO’s in response to overleveraging, which caused the micro-lenders to tighten eligibility and reduce disbursements, thereby shrinking the overall loan outstanding. The second reason is due to the lack of adequate funding support, which was addressed to some extent towards the end of the year, and may not have been reflected in the performance of FY 2025-26. The Government of India (GOI) introduced a guarantee scheme called Credit Guarantee Scheme for MFI 2.0 (CGSMFI 2.0), similar to the one introduced during COVID-19, with a higher corpus of ₹20,000 crore and a separate quota for small, medium and other MFIs.
Box 2.1: CGSMFI-2.0: Strengthening Credit Flow to Microfinance Institutions
Access to institutional funding remains critical for Microfinance Institutions (MFIs), particularly small and medium-sized institutions. During periods of funding constraints, Sa-Dhan, as an industry association and RBI-recognised SRO, consistently engaged with policymakers, banks, financial institutions and other stakeholders to highlight challenges in accessing bank finance, articulate the sector’s funding needs, and promote a conducive funding and regulatory environment to strengthen lender confidence and improve credit flow. Sa-Dhan also strongly recommended a dedicated allocation within the guarantee mechanism for small and medium-sized MFIs, ensuring that institutions facing greater challenges in accessing institutional and collateral-based credit can adequately benefit from the guarantee.
These efforts helped build a stronger case for a risk-sharing mechanism for lending to MFIs. The Government subsequently introduced CGSMFI-2.0 on 20 March 2026, with the objective of providing guarantee cover to eligible lending institutions for finance extended to NBFC-MFIs and MFIs for on-lending to small borrowers. The scheme envisaged facilitating credit flow of up to ₹20,000 crore to the sector.
Under the scheme, the guarantee coverage varies according to the size of the NBFC-MFI/MFI. Small institutions with AUM below ₹500 crore receive 80% guarantee cover, medium institutions with AUM of ₹500 crore to below ₹2,000 crore receive 75%, and large institutions with AUM of ₹2,000 crore and above receive 70%. The financial assistance is subject to an overall ceiling of 20% of the institution’s AUM. Following the June 2026 revision, the maximum loan amount for large NBFC-MFIs/MFIs was increased from ₹300 crore to ₹1,000 crore.
The scheme also provides for an interest-rate cap. Loans from MLIs to NBFC-MFIs/MFIs are capped at one-year MCLR or EBLR plus 2% per annum. For onward lending to small borrowers, the interest rate is capped at 1% below the institution’s average lending rate during the preceding six months. The guarantee fee is 0.50% per annum, calculated on the sanctioned amount during the first year and on the outstanding amount thereafter.
An important feature of CGSMFI-2.0 is its focus on improving access to funding for smaller and mid-sized MFIs. The scheme requires MLIs to allocate at least 5% of the total sanctioned amount to small NBFC-MFIs/MFIs with AUM below ₹500 crore and at least 10% to medium-sized institutions with AUM between ₹500 crore and ₹2,000 crore. This provision is intended to broaden the reach of the guarantee facility beyond the larger institutions.
As of 10 June 2026, loans aggregating ₹770 crore had been sanctioned under the scheme. The Government subsequently extended the validity of CGSMFI-2.0 up to 31 August 2026, or until guarantees amounting to ₹20,000 crore were issued, whichever was earlier.
CGSMFI-2.0 thus provides a risk-sharing mechanism between lenders and the guarantee framework, with the potential to improve liquidity and diversify funding sources for MFIs, particularly smaller and mid-sized institutions. Its effectiveness will depend on the extent to which eligible institutions are able to access the facility and translate the additional funding into responsible and sustainable lending to small borrowers.
2.3.2 State/UT-wise Loan Outstanding (in ₹ Cr.)
Table 2.4 outlines the loan outstanding across States and Union Territories. Year-on-Year analysis reveals that 30 States/UTs experienced a decline in loan outstanding, while only 6 States with relatively smaller microfinance exposure—Arunachal Pradesh (33%), Meghalaya (18%), Mizoram (14%), Nagaland (13%), Punjab (7%), and Assam (5%) registered positive Y-o-Y growth.
Table 2.4 Loan Outstanding (in ₹ Cr.) of all micro-lenders across States/UTs - March 2026 and March 2025 (in descending order of Loan Outstanding)
| Sl. No. | State/UT | March 2026 (in ₹ Cr.) |
March 2025 (in ₹ Cr.) |
Y-o-Y Growth (in %) |
|---|---|---|---|---|
| 1 | Bihar | 53,010 | 57,206 | -7% |
| 2 | Tamil Nadu | 41,004 | 45,866 | -11% |
| 3 | Uttar Pradesh | 39,680 | 41,305 | -4% |
| 4 | Karnataka | 29,429 | 34,928 | -16% |
| 5 | West Bengal | 28,054 | 35,950 | -22% |
| 6 | Maharashtra | 24,845 | 28,390 | -12% |
| 7 | Madhya Pradesh | 19,824 | 21,444 | -8% |
| 8 | Odisha | 17,387 | 20,139 | -14% |
| 9 | Rajasthan | 13,799 | 15,611 | -12% |
| 10 | Jharkhand | 10,911 | 11,176 | -2% |
| 11 | Gujarat | 9,120 | 10,661 | -14% |
| 12 | Keralam | 8,824 | 11,234 | -21% |
| 13 | Assam | 6,874 | 6,517 | 5% |
| 14 | Chhattisgarh | 5,750 | 6,429 | -11% |
| 15 | Andhra Pradesh | 5,577 | 5,660 | -1% |
| 16 | Punjab | 5,183 | 4,846 | 7% |
| 17 | Haryana | 4,926 | 5,285 | -7% |
| 18 | Telangana | 4,325 | 4,785 | -10% |
| 19 | Tripura | 1,465 | 2,093 | -30% |
| 20 | Uttarakhand | 1,378 | 1,692 | -19% |
| 21 | Puducherry | 941 | 973 | -3% |
| 22 | Delhi | 498 | 590 | -16% |
| 23 | Himachal Pradesh | 179 | 184 | -2% |
| 24 | Meghalaya | 165 | 140 | 18% |
| 25 | Arunachal Pradesh | 134 | 101 | 33% |
| 26 | Mizoram | 123 | 108 | 14% |
| 27 | Goa | 99 | 149 | -33% |
| 28 | Others | 93 | 142 | -35% |
| 29 | Jammu & Kashmir | 78 | 93 | -16% |
| 30 | Sikkim | 70 | 119 | -41% |
| 31 | Nagaland | 67 | 59 | 13% |
| 32 | Manipur | 41 | 75 | -45% |
| 33 | Chandigarh | 32 | 34 | -5% |
| 34 | Andaman & Nicobar Islands | 17 | 17 | -3% |
| 35 | Dadra and Nagar Haveli and Daman and Diu | 5 | 6 | -15% |
| 36 | Lakshadweep | 0.004 | 0.010 | -59% |
| 37 | Ladakh | 0.000 | 0.003 | -100% |
| Sector | 3,33,907 | 3,74,006 | -11% |
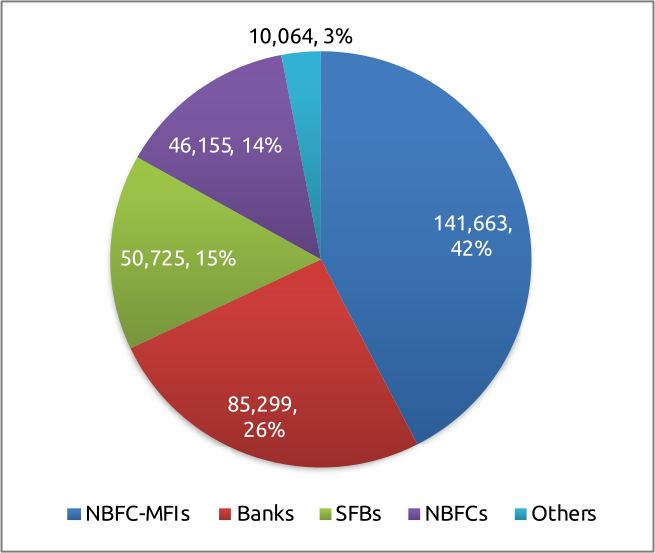
Figure 2.4: Market Share (in %) of micro-lenders in terms of Loan Outstanding (in ₹ Cr.)
Bihar retained its position as the largest microfinance market in the country, accounting for 16% of the sector’s loan outstanding, followed by Tamil Nadu and Uttar Pradesh at 12% each. Together, the top 5 states, Bihar, Tamil Nadu, Uttar Pradesh, Karnataka and West Bengal, account for 57% of the sector’s loan outstanding, indicating that microfinance credit exposure remains geographically concentrated within a few key states.
Notably, the principal key states with the highest loan outstanding, including West Bengal (-22%), Karnataka (-16%), Tamil Nadu (-11%), Bihar (-7%), and Uttar Pradesh (-4%), etc., saw a contraction in the loan outstanding, reflecting broad-based negative growth in these key states.
In terms of market share of loan outstanding, NBFC-MFIs remain the dominant provider of microcredit, accounting for 42% of the total market. Banks held the second-largest share with 26%, followed by Small Finance Banks (SFBs) at 15%, NBFCs at 14%, and Others comprising the remaining 3%.
2.3.3 State/UT-wise Loan Outstanding per Unique Active Borrower (in ₹)
Table 2.5 provides data on loan outstanding per unique active borrower across States and Union Territories, showing modest year-on-year growth of 3%. This marginal increase is mainly attributable to a more cautious and risk-limiting stance adopted by micro-lenders in response to rising delinquencies and increased borrower leverage. Additional contributing factors include limiting measures imposed by the SROs, such as restrictions on the number of micro-lenders and caps on combined microfinance and retail loan exposure for households, which is not to exceed ₹2 lakhs.
Table 2.5 Loan Outstanding per Unique Active Borrower across States/UTs (in ₹) - March 2026 and March 2025 (in descending order of Loan Outstanding per Unique Active Borrower)
| Sl. No. | State/UT | March 2026 (in ₹) |
March 2025 (in ₹) |
Y-o-Y Growth (in %) |
|---|---|---|---|---|
| 1 | Bihar | 59,070 | 50,049 | 18% |
| 2 | Arunachal Pradesh | 58,161 | 42,010 | 38% |
| 3 | Karnataka | 55,483 | 54,686 | 1% |
| 4 | Jharkhand | 53,969 | 46,609 | 16% |
| 5 | Puducherry | 52,983 | 52,722 | 0.5% |
| 6 | Tamil Nadu | 51,537 | 59,191 | -13% |
| 7 | Himachal Pradesh | 50,680 | 44,882 | 13% |
| 8 | Keralam | 50,591 | 52,543 | -4% |
| 9 | Uttar Pradesh | 50,225 | 44,408 | 13% |
| 10 | Maharashtra | 49,119 | 46,260 | 6% |
| 11 | Odisha | 49,117 | 48,300 | 2% |
| 12 | Haryana | 48,792 | 46,063 | 6% |
| 13 | Punjab | 48,329 | 44,303 | 9% |
| 14 | West Bengal | 47,752 | 48,479 | -1% |
| 15 | Rajasthan | 47,273 | 46,661 | 1% |
| 16 | Andaman & Nicobar Islands | 46,517 | 41,096 | 13% |
| 17 | Madhya Pradesh | 46,338 | 45,067 | 3% |
| 18 | Chhattisgarh | 46,005 | 45,639 | 1% |
| 19 | Uttarakhand | 45,025 | 44,380 | 1% |
| 20 | Goa | 44,591 | 42,777 | 4% |
| 21 | Dadra and Nagar Haveli and Daman and Diu | 44,042 | 36,710 | 20% |
| 22 | Tripura | 43,617 | 49,396 | -12% |
| 23 | Jammu & Kashmir | 43,276 | 45,440 | -5% |
| 24 | Gujarat | 42,844 | 42,192 | 2% |
| 25 | Mizoram | 40,527 | 28,509 | 42% |
| 26 | Delhi | 39,984 | 39,747 | 1% |
| 27 | Nagaland | 39,358 | 37,466 | 5% |
| 28 | Meghalaya | 38,967 | 32,112 | 21% |
| 29 | Assam | 38,682 | 39,834 | -3% |
| 30 | Chandigarh | 38,427 | 37,020 | 4% |
| 31 | Sikkim | 33,939 | 39,311 | -14% |
| 32 | Telangana | 33,900 | 37,690 | -10% |
| 33 | Andhra Pradesh | 30,492 | 30,588 | -0.3% |
| 34 | Lakshadweep | 19,967 | 19,344 | 3% |
| 35 | Manipur | 18,877 | 24,936 | -24% |
| 36 | Others | 6,611 | 28,766 | -77% |
| 37 | Ladakh | N.A. | 6,332 | N.A. |
| Sector | 49,658 | 48,171 | 3% |
On a Y-o-Y comparison, 10 States/UTs recorded a decline in loan outstanding per borrower, while 25 States/UTs registered positive growth in loan outstanding per borrower. The principal key states with substantial loan outstanding, such as Bihar (18%), Uttar Pradesh (13%), Maharashtra (6%), Madhya Pradesh (3%), Odisha (2%), Karnataka (1%), Rajasthan (1%), etc., registered growth in loan outstanding per borrower, while Tamil Nadu (-13%) and West Bengal (-1%) registered a decline in loan outstanding per borrower.
Figure 2.5: Percentage of Rural, Urban and Semi-Urban Share of Micro-Lenders Loan Outstanding
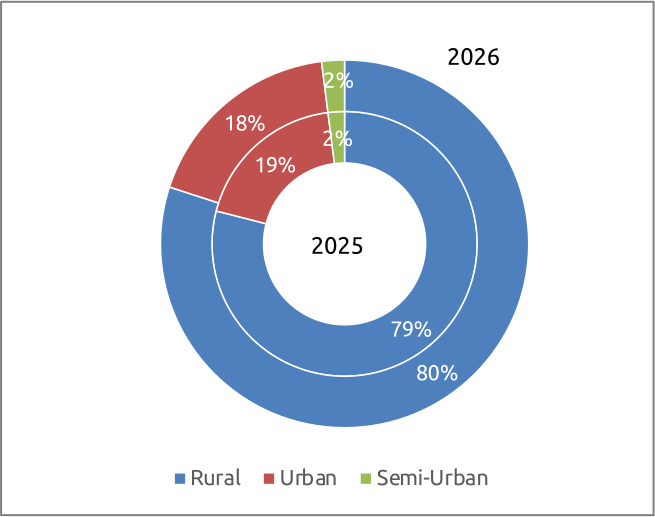
As illustrated in Figure 2.5, the loan outstanding geographical composition continues to exhibit a pronounced rural orientation. During FY 2025-26, the rural segment accounted for 80% of the aggregate loan outstanding, with the urban and semi-urban segments contributing 18% and 2%, respectively. This distribution is broadly consistent with the pattern observed in FY 2024-25, when the rural segment constituted 79% of the aggregate loan outstanding, while the urban and semi-urban segments accounted for 19% and 2%, respectively — reflecting a marginal but noteworthy 1 percentage-point shift toward rural concentration year-on-year. This sustained and deepening skew toward rural geographies across both financial years reaffirms that microfinance, in its essential nature, remains fundamentally a rural phenomenon, being oriented toward addressing the credit needs of underserved and financially excluded rural populations who typically fall outside the ambit of conventional banking channels.
Figure 2.6: Regional distribution of Loan Outstanding (in %)
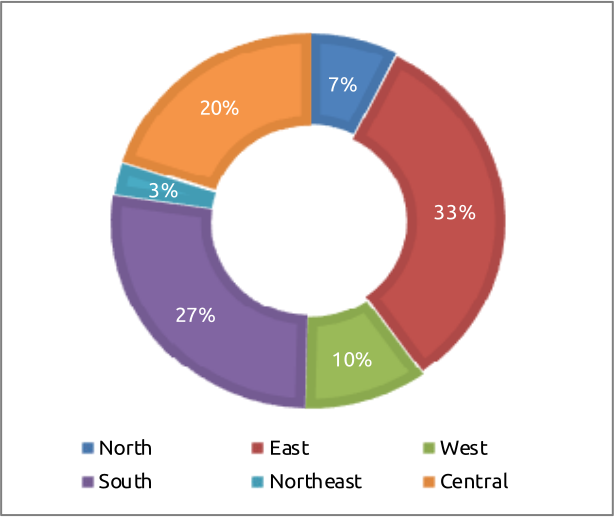
In terms of regional distribution of loan outstanding, the Eastern region—comprising Bihar, Odisha, Jharkhand, West Bengal, and Andaman & Nicobar Islands—led with a 33% market share. This was followed by the Southern region, which includes Andhra Pradesh, Karnataka, Keralam, Tamil Nadu, Telangana, Puducherry, and Lakshadweep, accounting for 27%. The Central region, consisting of Madhya Pradesh, Uttar Pradesh, Chhattisgarh, and Uttarakhand, held 20% of the market share. The Western region, covering Gujarat, Maharashtra, Goa, and Dadra and Nagar Haveli and Daman and Diu, contributed 10%, while the Northern region—encompassing Delhi, Haryana, Rajasthan, Punjab, Chandigarh, Himachal Pradesh, Jammu & Kashmir, and Ladakh—accounted for 7%. The Northeastern states, including Assam, Manipur, Tripura, Nagaland, Sikkim, Meghalaya, Mizoram, and Arunachal Pradesh, have the smallest share at 3%.
2.3.4 State/UT-wise Average Balance per Loan Account (in ₹)
The State and Union Territory-wise average balance per loan account is detailed in Table 2.6. As of March 31, 2026, the overall average balance per loan account in the microfinance sector stood at ₹32,116, reflecting a year-on-year growth of 13% from ₹28,385 as on March 31, 2025.
Table 2.6: Average Balance per Loan Account (in ₹) - March 2026 and March 2025 (in descending order of Average Balance per Loan Account)
| Sl. No. | State/UT | March 2026 (in ₹) |
March 2025 (in ₹) |
Y-o-Y Growth (in %) |
|---|---|---|---|---|
| 1 | Andaman & Nicobar Islands | 43,249 | 37,626 | 15% |
| 2 | Arunachal Pradesh | 38,104 | 30,590 | 25% |
| 3 | Puducherry | 37,908 | 31,184 | 22% |
| 4 | Tamil Nadu | 36,243 | 31,410 | 15% |
| 5 | Himachal Pradesh | 35,567 | 31,895 | 12% |
| 6 | Bihar | 34,317 | 28,950 | 19% |
| 7 | Delhi | 33,883 | 31,109 | 9% |
| 8 | Dadra and Nagar Haveli and Daman and Diu | 33,792 | 28,735 | 18% |
| 9 | Mizoram | 33,628 | 26,417 | 27% |
| 10 | Haryana | 33,457 | 29,066 | 15% |
| 11 | Karnataka | 33,272 | 28,396 | 17% |
| 12 | Uttar Pradesh | 32,886 | 28,438 | 16% |
| 13 | Rajasthan | 32,196 | 28,451 | 13% |
| 14 | Meghalaya | 31,744 | 27,055 | 17% |
| 15 | Gujarat | 31,718 | 27,760 | 14% |
| 16 | Tripura | 31,386 | 32,036 | -2% |
| 17 | West Bengal | 31,293 | 30,411 | 3% |
| 18 | Nagaland | 31,258 | 32,628 | -4% |
| 19 | Madhya Pradesh | 31,172 | 27,653 | 13% |
| 20 | Uttarakhand | 31,110 | 27,988 | 11% |
| 21 | Assam | 31,085 | 26,933 | 15% |
| 22 | Jharkhand | 31,009 | 26,862 | 15% |
| 23 | Chhattisgarh | 30,673 | 27,193 | 13% |
| 24 | Punjab | 30,580 | 25,743 | 19% |
| 25 | Maharashtra | 30,124 | 27,010 | 12% |
| 26 | Keralam | 29,977 | 27,886 | 7% |
| 27 | Sikkim | 29,549 | 33,185 | -11% |
| 28 | Jammu & Kashmir | 28,954 | 30,062 | -4% |
| 29 | Goa | 28,750 | 26,108 | 10% |
| 30 | Odisha | 28,203 | 24,957 | 13% |
| 31 | Chandigarh | 26,634 | 25,368 | 5% |
| 32 | Telangana | 25,740 | 27,408 | -6% |
| 33 | Andhra Pradesh | 24,993 | 22,903 | 9% |
| 34 | Manipur | 18,267 | 22,701 | -20% |
| 35 | Lakshadweep | 9,983 | 16,120 | -38% |
| 36 | Others | 6,358 | 22,578 | -72% |
| 37 | Ladakh | N.A. | 6,332 | N.A. |
| Sector | 32,116 | 28,385 | 13% |
On a Y-o-Y comparison, 7 States and UTs, viz. Lakshadweep (-38%), Manipur (-20%), Sikkim (-11%), Telangana (-6%), Nagaland and Jammu & Kashmir (-4% each) and Tripura (-2%) experienced a decrease in average balance per loan account. The principal key states with substantial loan outstanding, such as Bihar (19%), Karnataka (17%), Uttar Pradesh (16%), Tamil Nadu and Jharkhand (15% each), Madhya Pradesh, Rajasthan, and Odisha (13% each), and Maharashtra (12%), etc., registered positive Y-o-Y growth in average balance per loan account.
2.3.5 Top States and Districts in terms of Loan Outstanding
The top 10 States and top 25 districts in terms of total loan outstanding at the end of FY 2025-26 are given in Table 2.7 and Table 2.8, respectively. Bihar continues to be the top state in terms of loan outstanding, accounting for 16% of the sector’s loan outstanding, and the top 5 states account for nearly 57% of the sector’s loan outstanding.
Table 2.7: Top 10 States in terms of Loan Outstanding (in ₹ Cr.)
| Microfinance Sector – all micro-lenders | ||
|---|---|---|
| Sl. No. | State | Loan Outstanding (in ₹ Cr.) |
| 1 | Bihar | 53,010 |
| 2 | Tamil Nadu | 41,004 |
| 3 | Uttar Pradesh | 39,680 |
| 4 | Karnataka | 29,429 |
| 5 | West Bengal | 28,054 |
| 6 | Maharashtra | 24,845 |
| 7 | Madhya Pradesh | 19,824 |
| 8 | Odisha | 17,387 |
| 9 | Rajasthan | 13,799 |
| 10 | Jharkhand | 10,911 |
The top 10 states accounted for 83% of the share in the sector loan outstanding, while the top 5 states alone accounted for 57% of the sector loan outstanding.
Similarly, the loan outstanding of the top 25 districts in the country is mapped and given below. This data is the cumulative outstanding of all the micro-lenders as of 31st March 2026 in these 25 districts.
Table 2.8 Top 25 Districts in terms of Loan Outstanding (in ₹ Cr.)
| Microfinance Sector – all micro-lenders | |||
|---|---|---|---|
| Sl. No. | State | District | Loan Outstanding (in ₹ Cr.) |
| 1 | Bihar | Purbi Champaran | 4,004 |
| 2 | Bihar | Muzaffarpur | 3,624 |
| 3 | West Bengal | Murshidabad | 3,368 |
| 4 | Bihar | Samastipur | 3,199 |
| 5 | Bihar | Darbhanga | 2,946 |
| 6 | Bihar | Paschim Champaran | 2,770 |
| 7 | Bihar | Madhubani | 2,656 |
| 8 | Tamil Nadu | Cuddalore | 2,570 |
| 9 | Karnataka | Belagavi | 2,395 |
| 10 | West Bengal | North 24 Parganas | 2,386 |
| 11 | Uttar Pradesh | Gorakhpur | 2,245 |
| 12 | Tamil Nadu | Thanjavur | 2,214 |
| 13 | Bihar | Araria | 2,174 |
| 14 | Karnataka | Mysuru | 2,083 |
| 15 | Bihar | Begusarai | 2,004 |
| 16 | West Bengal | South 24 Parganas | 1,937 |
| 17 | Tamil Nadu | Madurai | 1,906 |
| 18 | Karnataka | Bengaluru Urban | 1,897 |
| 19 | Tamil Nadu | Salem | 1,856 |
| 20 | Bihar | Vaishali | 1,823 |
| 21 | Bihar | Gaya | 1,786 |
| 22 | Karnataka | Tumakuru | 1,745 |
| 23 | Bihar | Sitamarhi | 1,734 |
| 24 | Bihar | Katihar | 1,716 |
| 25 | West Bengal | Hooghly | 1,715 |
The top 25 districts by loan outstanding included 12 districts from Bihar, 4 districts each from Karnataka, Tamil Nadu, and West Bengal, and 1 district from Uttar Pradesh. The top 15 districts had loan outstanding exceeding ₹2,000 Cr., while Purbi Champaran district of Bihar recorded the highest loan outstanding, exceeding ₹4,000 Cr. The combined loan outstanding of the top 25 districts accounted for 18% of the sector loan outstanding, while the top 10 districts alone contributed 9%. A notable decline was observed in the number of districts with loan outstanding greater than ₹2,000 Cr., falling from 24 as of 31 March, 2025, to 15 as of 31 March, 2026.
2.3.6 District-wise Loan Outstanding
Figure 2.7: Geographic Distribution of Microfinance Loan Outstanding across Districts (as of March 2026)
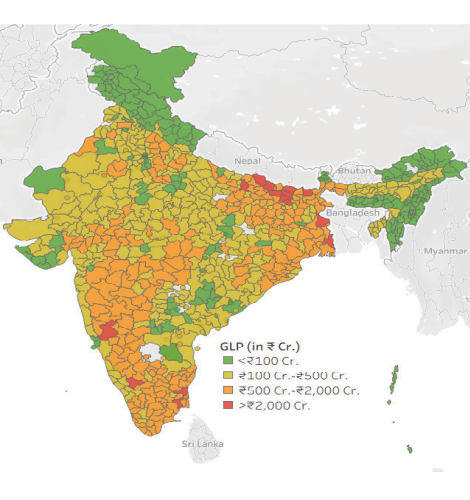
Table 2.9 District Distribution by Loan Outstanding Category
| Loan Outstanding Category | No. of Districts |
|---|---|
| <₹100 Cr. | 216 |
| ₹100 Cr. - ₹500 Cr. | 334 |
| ₹500 Cr. - ₹2,000 Cr. | 215 |
| >₹2,000 Cr. | 15 |
According to data from Equifax India, micro-lenders operate across nearly 780 districts in 28 States and 7 Union Territories. Among these, 15 districts have loan outstanding exceeding ₹2,000 Cr. This group includes 8 districts in Bihar, 2 districts each in Karnataka, Tamil Nadu and West Bengal, and 1 district in Uttar Pradesh. A further breakdown reveals that 11 districts have loan outstanding above ₹2,000 Cr. but less than ₹3,000 Cr., 3 districts have loan outstanding exceeding ₹3,000 Cr. but less than ₹4,000 Cr., and only 1 district (Purbi Champaran of Bihar) recorded loan outstanding above ₹4,000 Cr.
The number of districts with GLP above ₹2,000 Cr. declined from 24 in FY 2024-25 to 15 in FY 2025-26. Loan outstanding between ₹500 Cr. and ₹2,000 Cr. was reported in 215 districts, primarily from states such as Bihar, Tamil Nadu, Uttar Pradesh, West Bengal, Karnataka, Madhya Pradesh, Odisha, Jharkhand, Rajasthan, and Maharashtra. Additionally, 334 districts recorded loan outstanding in the range of ₹100 Cr.–₹500 Cr., while another 216 districts have loan outstanding below ₹100 Cr.
2.3.7 Aspirational Districts – Loan Outstanding
Aspirational Districts4 are the 112 districts identified by NITI Aayog in January 2018 to boost human development outcomes across health and nutrition, education, agriculture and water resources, financial inclusion, skill development, and basic infrastructure, and they remain a closely watched segment within India’s microfinance sector as of March 2026.
Table 2.10 Loan Outstanding Amount (in ₹ Cr.) in Aspirational Districts by Micro Lender Type (March 2026 and March 2025)
| Micro Lender | March 2026 | March 2025 | Micro Lender Share (in %) | Y-o-Y Growth (in %) |
|---|---|---|---|---|
| NBFC-MFIs | 23,192 | 22,605 | 46% | 3% |
| Banks | 13,446 | 18,164 | 26% | -26% |
| NBFCs | 6,496 | 6,111 | 13% | 6% |
| SFBs | 6,370 | 7,183 | 13% | -11% |
| Others | 1,235 | 661 | 2% | 87% |
| Overall | 50,739 | 54,724 | -7% |
As of March 2026, the loan outstanding across aspirational districts stood at ₹50,739 crore, accounting for 15% of the total microfinance sector portfolio. On a year-on-year basis, the portfolio contracted by 7% from ₹54,724 crore in March 2025, demonstrating greater resilience than the broader sector, which registered a decline of 11% over the same period. Also, channelling ₹50,739 Cr. (15% of the sector loan outstanding) into 112 Aspirational Districts directly supports targeted poverty alleviation and bridges regional credit disparities.
Figure 2.8: Share of Microfinance Loan Outstanding across Aspirational Districts by Micro-Lender Type (as of March 2026)
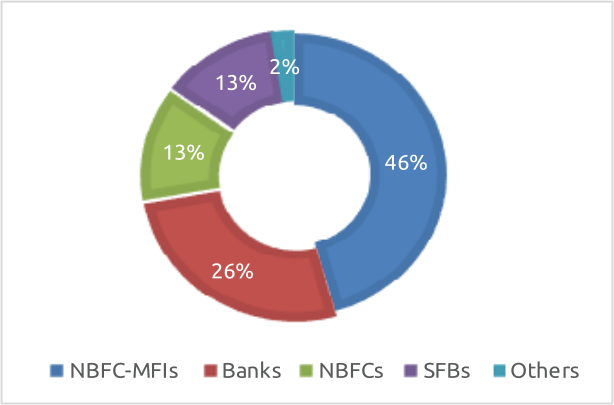
Among the micro-lenders, NBFC-MFIs have the maximum share of loan outstanding of 46% in the aspirational districts, followed by Banks at 26%, SFBs and NBFCs at 13% each and Others (2%), respectively.
4 https://www.niti.gov.in/sites/default/files/2022-09/List-of-Aspirational-Districts.pdf
2.4 Asset Quality and Delinquency Overview
2.4.1 Delinquency5 (in %)
This section depicts the delinquency in the microfinance sector during FY 2025-26, expressed in terms of Portfolio At Risk (PAR) for various buckets. The PAR 30-179 DPD improved significantly to 2.3%, from 6.6% in the last financial year. The delinquency under various buckets depicted in the table below indicates that PAR under all buckets have improved except for the PAR 180+ DPD bucket.
Table 2.11 Delinquency under various buckets for Sector as of March 2026 and March 2025
| Micro-Lender | March 2026 | March 2025 | ||||||
|---|---|---|---|---|---|---|---|---|
| PAR 30-179 DPD | PAR 60-179 DPD | PAR 90-179 DPD | PAR 180+ DPD | PAR 30-179 DPD | PAR 60-179 DPD | PAR 90-179 DPD | PAR 180+ DPD | |
| NBFC-MFIs | 2.13% | 1.75% | 1.33% | 10.44% | 6.89% | 5.51% | 4.20% | 7.82% |
| Banks | 2.97% | 2.45% | 1.88% | 23.66% | 6.89% | 5.53% | 4.10% | 12.69% |
| NBFCs | 1.69% | 1.27% | 0.91% | 5.16% | 4.10% | 2.89% | 2.01% | 3.68% |
| SFBs | 2.46% | 2.01% | 1.54% | 27.14% | 7.46% | 6.11% | 4.54% | 17.64% |
| Others | 4.89% | 4.02% | 2.95% | 57.34% | 8.91% | 6.34% | 4.26% | 22.75% |
| Sector | 2.34% | 1.91% | 1.45% | 17.04% | 6.63% | 5.27% | 3.92% | 10.67% |
The portfolio dynamics between March 2026 and March 2025 reveal a clear structural split: rapid recovery in active repayment behaviour alongside an accumulation of legacy defaulted loans. Sector-wide short-to-medium-term stress has decreased, with PAR 30–179 DPD significantly improving from 6.63% to 2.34% and PAR 90–179 DPD falling to 1.45%. This sharp decline in early-stage slippages underscores the impact of stricter underwriting guardrails, tighter caps on borrower indebtedness, and overall disciplined post-stress originations across lenders.
However, this improved operational stability contrasts with an ageing loss book. Sector-wide hard non-performing assets (PAR 180+ DPD) expanded from 10.67% to 17.04%, driven by accumulation among Banks (23.66%) and Small Finance Banks (27.14%). On the other hand, Specialised NBFC-MFIs (10.44% PAR 180+ DPD) and NBFCs (5.16% PAR 180+ DPD) have managed legacy risk far better, highlighting the resilience of dedicated field-level group monitoring. The higher level of PAR 180+ DPD with Banks is due to their different policy. Moreover, NBFCs and NBFC-MFIs adopt a better recovery mechanism with close follow-up.
5 The delinquency figures presented here differ from those presented in Chapter 3A and Chapter 4.2 because MLIs data reported to the CICs include technical write-offs, whereas the MLIs data submitted to the SROs exclude technical write-offs.
State/UT wise data further corroborate this downward trend in delinquency across the sector. Detailed delinquency percentages by various buckets for each State and Union Territory are provided in Table 2.12.
Table 2.12: States/UTs-wise overall delinquency (in %) under different buckets as of March 2026 (in descending order of Loan Outstanding)
| Sl. No. | State/UT | Loan Outstanding (in ₹ Cr.) |
PAR 30-179 DPD (in %) |
PAR 60-179 DPD (in %) |
PAR 90-179 DPD (in %) |
PAR 180+ DPD (in %) |
|---|---|---|---|---|---|---|
| 1 | Bihar | 53,010 | 2.23% | 1.82% | 1.40% | 13.95% |
| 2 | Tamil Nadu | 41,004 | 1.88% | 1.54% | 1.17% | 18.62% |
| 3 | Uttar Pradesh | 39,680 | 2.37% | 1.92% | 1.47% | 14.17% |
| 4 | Karnataka | 29,429 | 2.29% | 1.88% | 1.46% | 19.91% |
| 5 | West Bengal | 28,054 | 2.65% | 2.04% | 1.36% | 11.85% |
| 6 | Maharashtra | 24,845 | 2.60% | 2.22% | 1.76% | 19.44% |
| 7 | Madhya Pradesh | 19,824 | 2.88% | 2.39% | 1.87% | 18.20% |
| 8 | Odisha | 17,387 | 2.17% | 1.87% | 1.50% | 23.47% |
| 9 | Rajasthan | 13,799 | 2.84% | 2.28% | 1.67% | 17.75% |
| 10 | Jharkhand | 10,911 | 1.95% | 1.63% | 1.27% | 18.13% |
| 11 | Gujarat | 9,120 | 3.15% | 2.53% | 1.91% | 17.93% |
| 12 | Keralam | 8,824 | 1.72% | 1.41% | 0.94% | 28.03% |
| 13 | Assam | 6,874 | 0.66% | 0.51% | 0.37% | 17.68% |
| 14 | Chhattisgarh | 5,750 | 1.94% | 1.61% | 1.26% | 16.85% |
| 15 | Andhra Pradesh | 5,577 | 2.88% | 2.35% | 1.80% | 12.99% |
| 16 | Punjab | 5,183 | 1.51% | 1.10% | 0.80% | 19.65% |
| 17 | Haryana | 4,926 | 2.38% | 1.91% | 1.36% | 15.16% |
| 18 | Telangana | 4,325 | 5.43% | 4.32% | 3.32% | 12.87% |
| 19 | Tripura | 1,465 | 2.66% | 2.18% | 1.60% | 13.04% |
| 20 | Uttarakhand | 1,378 | 2.32% | 1.88% | 1.46% | 14.98% |
| 21 | Puducherry | 941 | 1.39% | 1.16% | 0.89% | 14.54% |
| 22 | Delhi | 498 | 2.15% | 1.68% | 1.24% | 19.94% |
| 23 | Himachal Pradesh | 179 | 1.08% | 0.81% | 0.57% | 5.46% |
| 24 | Meghalaya | 165 | 0.91% | 0.64% | 0.44% | 7.23% |
| 25 | Arunachal Pradesh | 134 | 2.09% | 1.50% | 0.89% | 3.92% |
| 26 | Mizoram | 123 | 0.64% | 0.50% | 0.33% | 4.41% |
| 27 | Goa | 99 | 1.68% | 1.36% | 0.99% | 14.58% |
| 28 | Others | 93 | 1.36% | 1.08% | 0.90% | 45.87% |
| 29 | Jammu & Kashmir | 78 | 2.06% | 1.63% | 1.20% | 11.12% |
| 30 | Sikkim | 70 | 3.33% | 2.62% | 1.80% | 14.21% |
| 31 | Nagaland | 67 | 0.54% | 0.33% | 0.22% | 1.34% |
| 32 | Manipur | 41 | 5.83% | 4.33% | 2.90% | 52.37% |
| 33 | Chandigarh | 32 | 2.63% | 2.03% | 1.52% | 21.56% |
| 34 | Andaman & Nicobar Islands | 17 | 0.13% | 0.10% | 0.07% | 2.97% |
| 35 | Dadra and Nagar Haveli and Daman and Diu | 5 | 1.32% | 0.88% | 0.66% | 9.59% |
| 36 | Lakshadweep | 0 | 0.00% | 0.00% | 0.00% | 34.48% |
| 37 | Ladakh | N.A. | N.A. | N.A. | N.A. | N.A. |
| Sector | 3,33,907 | 2.34% | 1.91% | 1.45% | 17.04% |
Delinquency levels have improved across the sector. States with significant loan outstanding, such as Karnataka (2.29%), Bihar (2.23%), Odisha (2.17%), Tamil Nadu (1.88%), and Jharkhand (1.95%), reported below the sector PAR 30-179 DPD of 2.34%. In contrast, major states including Madhya Pradesh (2.88%), Rajasthan (2.84%), West Bengal (2.65%), Maharashtra (2.60%), and Uttar Pradesh (2.37%) exhibited PAR 30-179 DPD levels exceeding the sector’s average. The elevated PAR 180+ DPD values primarily reflect loans that have become Non-Performing Assets (NPAs) over a period of time, and continue to be reported as receivables in credit bureau records.
2.4.2 Aspirational Districts - Delinquency
Table 2.13 Delinquency (in %) in Aspirational Districts by Micro-Lender Type
| Micro-Lender | March 2026 | March 2025 | ||
|---|---|---|---|---|
| PAR 30-179 DPD (in %) | PAR 90-179 DPD (in %) | PAR 30-179 DPD (in %) | PAR 90-179 DPD (in %) | |
| NBFC-MFIs | 2.06% | 1.29% | 7.49% | 4.85% |
| Banks | 2.91% | 1.98% | 7.24% | 4.94% |
| NBFCs | 1.33% | 0.70% | 3.60% | 1.95% |
| SFBs | 2.75% | 1.81% | 9.40% | 6.29% |
| Others | 4.69% | 2.91% | 9.86% | 5.25% |
| Overall | 2.26% | 1.45% | 7.19% | 4.71% |
As can be observed from the above table, in the aspirational districts, there is a sharp improvement in credit quality: the overall PAR 30-179 DPD in aspirational districts improved from 7.19% in March 2025 to 2.26% in March 2026, while PAR 90-179 DPD improved from 4.71% to 1.45% over the same period. Breaking this down by micro-lender type, NBFCs reported the lowest PAR 30-179 DPD among the micro-lenders in these districts at around 1.33%, while Others reported the highest delinquency near 4.69%. This improvement mirrors the broader sector-wide recovery in asset quality, where overall PAR 30-179 DPD improved from 6.63% in March 2025 to 2.34% in March 2026, partly attributable to write-offs by lenders.
2.5 Disbursement Overview
2.5.1 Disbursement Volume (Number of loans disbursed)
Figure 2.9 indicates the number of loans disbursed by all the micro-lenders during FY 2025-26, compared with the previous financial year. The data reveals a significant decline in loan disbursements, dropping from 532 lakh loans in FY 2024-25 to 419 lakh loans in FY 2025-26, representing a year-on-year decrease of 21%.
Figure 2.9: Number of Loans Disbursed (in lakhs) across micro-lenders
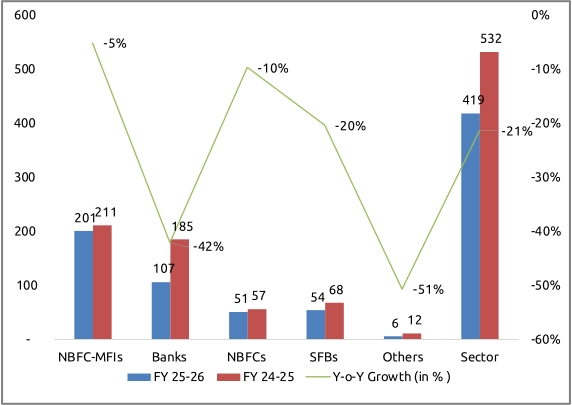
During the financial year 2025-26, the micro-lenders disbursed a total of 419 lakh loans. NBFC-MFIs led the disbursement with 201 lakh loans, constituting 48% of the total. Banks followed the NBFC-MFIs disbursing 107 lakh loans and accounting for 26% of the total. Other category of lenders contributed a minimal share of 1%.
All categories of micro-lenders experienced negative year-on-year growth in the number of loans disbursed during FY 2025-26. The steepest decline was observed in the ‘Others’ category with a (-51%) reduction, followed by Banks at (-42%), SFBs at (-20%), NBFCs at (-10%), and NBFC-MFIs at (-5%), respectively. This overall decrease in loan disbursement volume was primarily driven by a liquidity crunch and a cautious lending approach emphasising risk management after a phase of rapid expansion and rising defaults.
2.5.2 Loan Amount Disbursed (in ₹ Cr.)
During FY 2025-26, the total loan amount disbursed by all the micro-lenders together declined to ₹2,49,034 Cr., compared to ₹2,71,106 Cr. in FY 2024-25, marking a year-on-year decrease of (-8%). However, the last quarter (Q4 FY 26) saw a turnaround, recording a disbursement of ₹78,182 Cr. as against ₹66,259 Cr. in the corresponding quarter of the previous year (Q4 FY 25), indicating that the sector has started showing signs of revival. The State- and Union Territory-wise disbursement figures for FY 2025-26 are detailed in Table 2.14.
Table 2.14 Loan Amount Disbursed (in ₹ Cr.) of all micro-lenders across States/UTs during FY 2025-26 and FY 2024-25 (in descending order of Loan Amount Disbursed)
| Sl. No. | State/UT | During FY 2025-26 (in ₹ Cr.) |
During FY 2024-25 (in ₹ Cr.) |
Y-o-Y Growth (in %) |
|---|---|---|---|---|
| 1 | Bihar | 41,599 | 43,907 | -5% |
| 2 | Uttar Pradesh | 31,611 | 31,755 | -0.5% |
| 3 | Tamil Nadu | 28,315 | 30,505 | -7% |
| 4 | West Bengal | 23,164 | 26,814 | -14% |
| 5 | Karnataka | 20,980 | 24,911 | -16% |
| 6 | Maharashtra | 17,329 | 21,303 | -19% |
| 7 | Madhya Pradesh | 14,753 | 15,686 | -6% |
| 8 | Odisha | 12,004 | 13,831 | -13% |
| 9 | Rajasthan | 10,083 | 10,316 | -2% |
| 10 | Jharkhand | 8,771 | 8,738 | 0.4% |
| 11 | Gujarat | 6,620 | 7,101 | -7% |
| 12 | Assam | 5,369 | 4,422 | 21% |
| 13 | Keralam | 5,214 | 6,258 | -17% |
| 14 | Chhattisgarh | 4,461 | 4,876 | -9% |
| 15 | Andhra Pradesh | 4,358 | 5,128 | -15% |
| 16 | Punjab | 3,545 | 2,842 | 25% |
| 17 | Haryana | 3,520 | 3,364 | 5% |
| 18 | Telangana | 3,225 | 4,780 | -33% |
| 19 | Tripura | 1,222 | 1,459 | -16% |
| 20 | Uttarakhand | 1,055 | 1,208 | -13% |
| 21 | Puducherry | 646 | 711 | -9% |
| 22 | Delhi | 382 | 385 | -1% |
| 23 | Himachal Pradesh | 144 | 143 | 1% |
| 24 | Meghalaya | 144 | 112 | 29% |
| 25 | Arunachal Pradesh | 119 | 96 | 25% |
| 26 | Mizoram | 83 | 71 | 17% |
| 27 | Goa | 69 | 107 | -36% |
| 28 | Nagaland | 67 | 53 | 26% |
| 29 | Jammu & Kashmir | 53 | 70 | -24% |
| 30 | Sikkim | 50 | 70 | -28% |
| 31 | Others | 26 | 28 | -7% |
| 32 | Chandigarh | 22 | 21 | 3% |
| 33 | Manipur | 14 | 17 | -15% |
| 34 | Andaman & Nicobar Islands | 13 | 15 | -14% |
| 35 | Dadra and Nagar Haveli and Daman and Diu | 5 | 5 | -2% |
| 36 | Lakshadweep | 0.006 | 0.005 | 25% |
| Sector | 2,49,034 | 2,71,106 | -8% |
The top 5 states in terms of loan amount disbursed during FY 2025-26 were Bihar (₹41,599 Cr.), followed by Uttar Pradesh (₹31,611 Cr.), Tamil Nadu (₹28,315 Cr.), West Bengal (₹23,164 Cr.), and Karnataka (₹20,980 Cr.). Collectively, these 5 states accounted for 58% of the total amount disbursed by all the micro-lenders during the year.
Figure 2.10: Share of Loan Amount Disbursed (in ₹ Cr.)
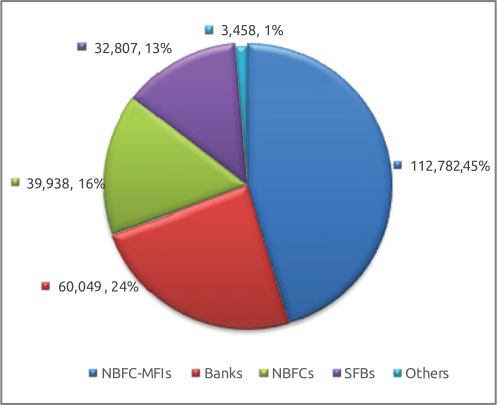
The combined micro-credit disbursements of all micro-lenders during FY 2025-26 were at ₹2,49,034 Cr., with the NBFC-MFIs having disbursed ₹1,12,782 Cr., followed by Banks (₹60,049 Cr.), NBFCs (₹39,938 Cr.), SFBs (₹32,807 Cr.), while Others disbursed only ₹3,458 Cr.
Figure 2.11: Area-wise segregation of Amount Disbursed (in ₹ Cr.)
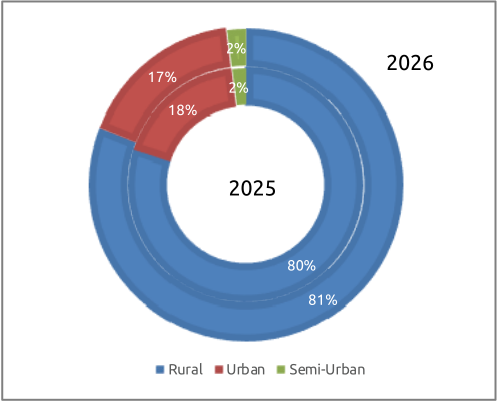
As depicted in Figure 2.11, the disbursement pattern during FY 2025-26 reflects a pronounced rural orientation, with rural areas accounting for 81% of total disbursements, while urban and semi-urban segments contributed 17% and 2%, respectively. A broadly consistent pattern was observed in the preceding year, FY 2024-25, wherein rural disbursements constituted 80% of cumulative disbursements, followed by urban disbursements at 18% and semi-urban disbursements at 2%.
This sustained and consistent trend across both financial years underscores that microfinance continues to remain predominantly a rural-centric phenomenon, reaffirming its foundational role in advancing financial inclusion for underserved and credit-deficient populations residing in rural geographies. The marginal year-on-year increase in the rural share (from 80% to 81%) further indicates a deepening penetration of micro-lenders in rural markets, reflecting the sector’s continued alignment with its core developmental mandate of extending affordable credit to the last mile.
2.5.3 Aspirational Districts - Disbursement
Table 2.15 Amount Disbursed (in ₹ Cr.) in Aspirational Districts by Micro Lender Type (During FY 2025-26 and FY 2024-25)
| Micro Lender | March 2026 | March 2025 | Micro Lender Share (in %) | Y-o-Y Growth (in %) |
|---|---|---|---|---|
| NBFC-MFIs | 19,142 | 16,926 | 49% | 13% |
| Banks | 9,834 | 14,735 | 25% | -33% |
| NBFCs | 5,663 | 4,736 | 14% | 20% |
| SFBs | 4,085 | 4,644 | 10% | -12% |
| Others | 423 | 722 | 1% | -41% |
| Overall | 39,147 | 41,763 | -6% |
Disbursements to these districts also moderated, falling by (-6%) from ₹41,763 Cr. in FY 2024-25 to ₹39,147 Cr. in FY 2025-26. Among the micro-lenders, NBFC-MFIs have the maximum share of disbursements of 49% in aspirational districts, followed by Banks at 25%, NBFCs at 14%, SFBs at 10% and Others at 1%, respectively.
2.6 Borrower Leverage
2.6.1 Average Ticket Size (ATS)
The Average Ticket Size (ATS) in the microfinance sector during FY 2025-26 reached ₹59,473, reflecting a 17% year-on-year growth from ₹50,918 in the previous financial year. Factors such as borrower over-leverage, operational caution, and the pursuit of sustainability in challenging conditions have made the micro-lenders cautious and selective, leading to higher ticket-size loans; hence, there is an upward trend in average ticket size.
As detailed in Table 2.16, the ATS increased year-on-year in 35 States and Union Territories, with only Andaman & Nicobar Islands registering a decline of (-0.5%). Among the principal key states with significant loan outstanding, Bihar led the increase in ATS, with a 23% increase, followed by Karnataka and Odisha (20% each), Uttar Pradesh (18%), Maharashtra (17%), Jharkhand (16%), Tamil Nadu and Rajasthan (14% each), Madhya Pradesh (13%), and West Bengal (10%), respectively.
Table 2.16: Average Ticket Size (ATS) (in ₹) During FY 2025-26 and FY 2024-25 (in descending order of ATS)
| Sl. No. | State/UT | During FY 2025-26 (in ₹) |
During FY 2024-25 (in ₹) |
Y-o-Y Growth (in %) |
|---|---|---|---|---|
| 1 | Puducherry | 76,450 | 65,956 | 16% |
| 2 | Andaman & Nicobar Islands | 72,598 | 72,951 | -0.5% |
| 3 | Tamil Nadu | 69,648 | 60,999 | 14% |
| 4 | Delhi | 69,187 | 57,857 | 20% |
| 5 | Dadra and Nagar Haveli and Daman and Diu | 68,761 | 56,425 | 22% |
| 6 | Himachal Pradesh | 64,063 | 54,092 | 18% |
| 7 | Haryana | 62,781 | 54,159 | 16% |
| 8 | Bihar | 62,709 | 50,980 | 23% |
| 9 | Karnataka | 62,245 | 51,696 | 20% |
| 10 | Keralam | 61,876 | 52,310 | 18% |
| 11 | Gujarat | 60,530 | 51,305 | 18% |
| 12 | Rajasthan | 60,231 | 52,632 | 14% |
| 13 | Arunachal Pradesh | 59,726 | 49,818 | 20% |
| 14 | Uttarakhand | 58,658 | 51,188 | 15% |
| 15 | Punjab | 58,404 | 52,217 | 12% |
| 16 | Goa | 58,269 | 51,281 | 14% |
| 17 | Others | 57,788 | 49,966 | 16% |
| 18 | Uttar Pradesh | 57,694 | 48,936 | 18% |
| 19 | Maharashtra | 56,984 | 48,835 | 17% |
| 20 | West Bengal | 56,233 | 51,105 | 10% |
| 21 | Tripura | 56,188 | 51,965 | 8% |
| 22 | Telangana | 56,074 | 47,217 | 19% |
| 23 | Odisha | 55,883 | 46,675 | 20% |
| 24 | Madhya Pradesh | 55,527 | 49,129 | 13% |
| 25 | Chandigarh | 55,489 | 50,148 | 11% |
| 26 | Jharkhand | 54,984 | 47,316 | 16% |
| 27 | Andhra Pradesh | 54,632 | 46,608 | 17% |
| 28 | Jammu & Kashmir | 54,551 | 45,499 | 20% |
| 29 | Chhattisgarh | 53,833 | 47,495 | 13% |
| 30 | Sikkim | 51,864 | 50,133 | 3% |
| 31 | Mizoram | 48,905 | 45,081 | 8% |
| 32 | Meghalaya | 48,862 | 46,423 | 5% |
| 33 | Assam | 48,860 | 43,833 | 11% |
| 34 | Nagaland | 46,475 | 43,713 | 6% |
| 35 | Manipur | 37,730 | 35,221 | 7% |
| 36 | Lakshadweep | 31,620 | 25,322 | 25% |
| Sector | 59,473 | 50,918 | 17% |
The top 10 States/UT in terms of Average Ticket Size are given below:
Figure 2.12: Top 10 States/UTs in terms of Average Ticket Size (ATS)
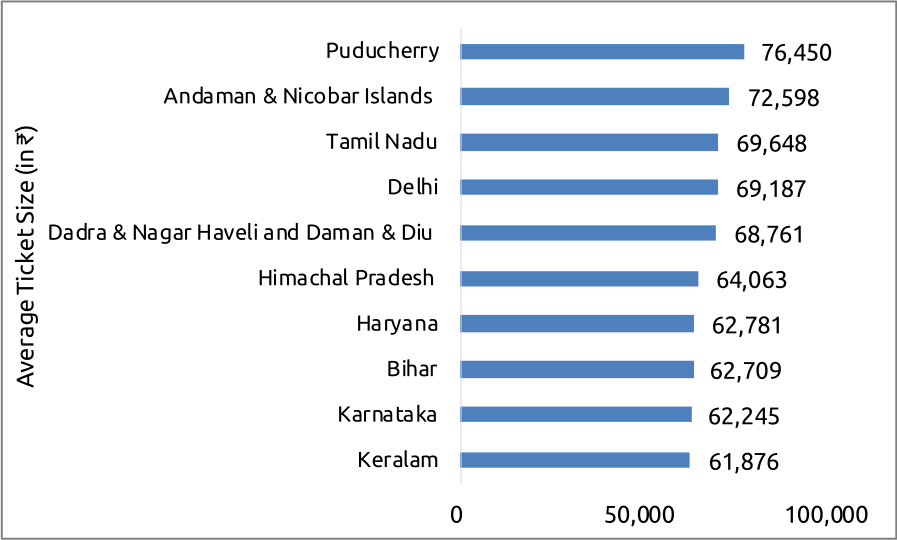
As shown in Figure 2.12, the Average Ticket Size (ATS) among the top 10 States and Union Territories, except for Tamil Nadu, Bihar, Karnataka, Keralam, and Haryana, the other States and UTs having higher ATS have relatively smaller microfinance footprints, where the presence of micro-lenders is relatively limited.
In some of these Union Territories, such as Dadra and Nagar Haveli and Daman and Diu, Andaman & Nicobar Islands, and Himachal Pradesh, the majority of loans are disbursed by Banks and Small Finance Banks (SFBs). This lending pattern likely contributes to the higher Average Ticket Size (ATS) observed in these regions.
Box 2.2: UPI-enabled Collections: Transforming Rural Repayments
As part of its digital transformation strategy, SAVE Microfinance Pvt. Ltd. (SMPL) has introduced a comprehensive digital collections ecosystem by integrating Unified Payments Interface (UPI), Bharat Bill Payment System (BBPS), Static QR (SQR), Dynamic QR (DQR), and SMS payment links. These digital payment channels have streamlined the collections process by enabling faster transactions, real-time reconciliation, improved transparency, and reduced manual intervention.
Digital collection is now active across 90% of branches, accounting for approximately 45% of total monthly collections. The shift to digital collections has strengthened operational efficiency by lowering cash-handling risks, reducing collection costs, improving portfolio monitoring, and enabling faster management decision-making. Customers receive instant payment confirmations and can conveniently make repayments anytime and anywhere, significantly enhancing their overall experience, particularly in rural and semi-urban areas.
To support this digital transition, SMPL has invested in strengthening the capabilities of its field workforce through a technology-enabled learning framework. A Learning Management System (LMS) offers self-paced and classroom-based training on products, processes, and emerging technologies. Interactive ethics and compliance modules use real-life scenarios to improve practical understanding, while Office 365 facilitates virtual training across geographically dispersed teams. In addition, state- and cluster-level WhatsApp groups enable real-time communication, rapid problem resolution, and continuous knowledge sharing.
Key Outcomes
- Faster, secure, and transparent loan collections through multiple digital payment channels.
- Reduced operational costs, cash-handling risks, and manual processing.
- Improved real-time reconciliation, portfolio monitoring, and governance.
- Enhanced customer convenience, trust, and digital adoption in rural and semi-urban areas.
- Strengthened digital capabilities of field staff through continuous learning and collaboration.
- Greater operational efficiency and support for a digitally enabled, sustainable microfinance ecosystem.
Courtesy: SAVE Microfinance Pvt. Ltd. (SMPL)
2.7 Way Forward for the Microfinance Sector
During FY 2025–26, the microfinance sector navigated a deliberate structural recalibration, transitioning from rapid volume expansion to risk-disciplined, high-quality underwriting. The loan portfolio stabilised around ₹3.34 lakh crore, while the loan accounts rationalised significantly due to strict adherence to SRO-mandated lender caps (restricting exposure to a maximum of 3 lenders per household) and enhanced credit bureau checks. Disbursements pivoted toward higher Average Ticket Sizes (~₹59,473) for carefully assessed borrowers, driving a sharp turnaround in asset quality: sector-wide PAR 30–179 DPD eased dramatically from 6.6% to 2.3%, demonstrating robust recovery in post-2024 vintage loans.
Thus, a year of stress, de-growth and underperformance of the portfolio has come to an end, with signs of revival, improved health and better asset quality. The revival of the sector is also due to the stricter guardrails enforced by the SROs, in addition to the self-discipline practised by the sectoral leaders. The funding needs were also addressed to some extent through CGSMFI 2.0. This has given a platform for the MLIs to perform better and build the sector in 2026-27.
In FY 2026–27, responsible lending and portfolio quality should remain the sector’s foremost priorities. The micro-lenders should strengthen household-level credit assessment, bureau-based indebtedness checks, cash-flow underwriting, early-warning systems and geo-segmented portfolio monitoring, while ensuring that repayment obligations remain aligned with household income and repayment capacity. Growth should be calibrated to local economic conditions rather than driven solely by disbursement targets. Greater use of consent-based digital data, alternative cash-flow indicators and risk-based pricing can improve underwriting, but technology must complement and not replace field-level assessment and borrower engagement.
Risk management practices are likely to continue evolving toward more granular portfolio monitoring, building on vintage-analysis techniques alongside climate-risk overlay models, rather than reliance on aggregate delinquency metrics alone. As erratic monsoons, unseasonal heatwaves, and extreme weather events increasingly disrupt rural livelihoods, geographical vulnerability has become directly tied to credit risk. Micro-lenders that combine credit-bureau leverage data with spatially disaggregated climate-vulnerability indices, such as identifying early-warning signals within specific origination cohorts and over-leveraged borrower segments, will stand to manage the next phase of growth with a materially lower risk of repeating the FY 2024–25 stress cycle.
In summary, the microfinance sector enters FY 2026-27 from a position of considerably improved credit discipline than a year earlier, with early but credible signs of a demand-led growth recovery. The sustainability of this recovery will depend on lenders, the regulator, and credit bureaus collectively maintaining the underwriting and leverage discipline established during the FY 2024-25 correction, even as competitive and growth pressures re-emerge with the return of disbursement momentum.